-
Documentation
-
About
- Getting Started & Use Cases
- Support
-
What's new
- Specify basins and protrusions by drawing their outer boundary
- Simplified path features
- National Norwegian high-resolution land cover map
- Organise and communicate on a digital canvas
- New sidebar to help organize your analyses and queries
- Sliding contours
- Ny skyfallsanalys och en ännu bättre marktäckekarta
- New land cover map for Finland
- Depths in the depression map
- New Danish land cover map with more classes
- National Swedish High-Resolution Impervious Surface Mapping
- Watershed tool updated with even better descriptions of catchment characteristics
- National Flash Flood Map with Infiltration and Drainage for Denmark
- Add your own WMS layers to SCALGO Live
- Enriched building data in Denmark
- National hydrological corrections and Land Cover for Poland
- National hydrological corrections for Norway
- Updated Impervious Surface Mapping for Denmark
- National hydrological corrections and updated local data for Finland
- Fast and intuitive tools to work with infiltration and land use
- Improvements to vector imports and exports
- National Danish groundwater model
- New Sweden high-resolution model
- New powerful depression map and more analyses visualization options
- Introducing Modelspaces: Get your hydrodynamic models into SCALGO Live
- Use case videos
- Access a EA flood maps inside SCALGO Live
- Improved map export
- New powerful ways to edit the elevation model
- Better coloring of flooding layers and sea-level depth filtering
- National Danish High-Resolution Impervious Surface Mapping
- National access for local and regional organizations
- Simpler, more powerful downloads
- Customize Layer Transparency
- Hydrological corrections and new data in Sweden
- Improved export functionality
- Access a wide range of authorative data inside SCALGO Live
- Importing VASP data
- Measure gradients, undo edits, and Norway updates
- New terrain edit features, soil balance information and much more...
- Browse historical orthophotos in SCALGO Live
- Emergency planning with sea-level rise from national forecast data
- Detailed information about watershed composition
- Better styling of imported vector layers
- New Danish Elevation Model
- Work with gradients in the profile widget
- Flood risk screening from rivers and flow paths
- New workspace tool: Raise and lower terrain uniformly
- Importing LandXML TINs, LAS point clouds
- New model in Sweden
- Side slopes on workspace features
- Drag and drop enhancements
- Swedish contour maps
- Subsurface basins and sewage drains in workspaces
- New Interface
- Volume information for watersheds and flow paths
- New powerful tool for emergency response and coastal flood prevention
- Denmark: New flash flood map
- Sweden: Geodatasamverkan setting for Swedish users
- Import custom terrain models
- New Hydrological Corrections
- Elevation contours now available
- Download orthophotos as JPEG and PNG
- Subsurface structures in workspace
- Sea-levels in terrain profiles
- Updated orthophotos
- Models and analysis update
- User interface updates
- User interface updates
- GeoDanmark/FOT data, Matrikelkortet now available
- New flash flood map
- Download of risk polygons
- Updated orthophotos
- Nationwide hydrology on the new DHM/2015 model now available
- New flash flood map computation available with watershed download
- DHM/2015 variants and sea-levels now available nationwide
- DHM/2015 now available nationwide
- Hydrology on the new DHM/2015 model now available
- New DHM/2015 Model - now with buildings
- New DHM Model
- Watershed Tool
- Ad hoc layers
- Nationwide contour maps for all countries
- User Interface
- Canvas
- Analysis
- Workspaces
- Hydrodynamic Engine
- Streams and Flow
- Modelspaces
- Country Specific
-
About
Analysis – Elevation Contours
A contour line or isohypse joins points of equal elevation. Maps illustrated with contour lines are commonly used for topographic maps - they use contour lines to show valleys, hills, and the steepness or gentleness of slopes.
The contour interval (or equidistance) of such a map is the difference in elevation between successive contour lines - maps typically used for hiking, for instance, use a contour interval of 10 m, so they show contour lines at every multiple of 10 m.

A map with contour lines.
The elevation layers in SCALGO Live rely on coloring and shading to represent elevation. If you prefer to look at elevations through contour lines, you can enable the "Contours" layer in the "Elevation" section of the library and choose a contour interval on the slider. These contour lines can be particularly useful on top of orthophotos or other non-elevation layers, when you want to view the elevation information at the same time.
How precise are the contour lines?
The contour line layers in SCALGO Live have been computed from the raw elevation data. The contour lines need to be simplified to be useful, but they never deviate from the actual elevation by more than half the contour interval. That is, if you pick a point on a contour line in the layer with the contour interval slider set to 50 cm and perform a point query, the terrain elevation will not differ by more than 25 cm from the contour line elevation. (However, small peaks and sinks of less than 10 m² area are dropped entirely, and in areas with low-resolution source data some additional interpolation is necessary that can degrade this guarantee.)
Peaks and sinks
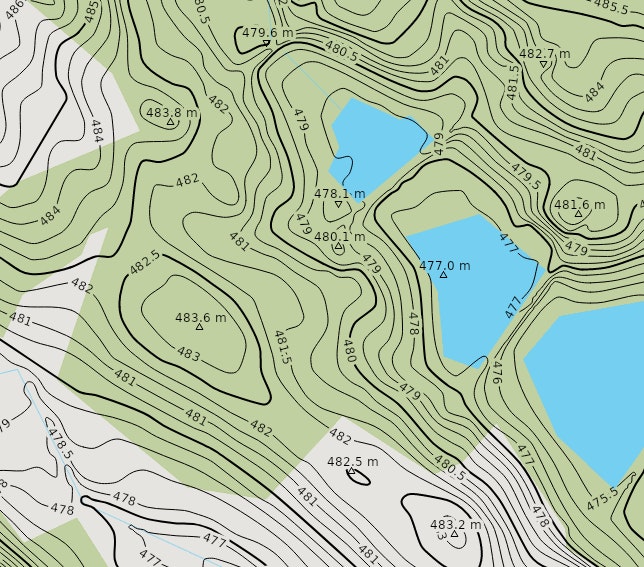
Contour lines with extrema (peaks and sinks).

Light contour lines on top of orthophotos
Downloading contour lines
Like many other layers, you can download data from the contour line layers by activating the Export Tool, drawing a rectangle or polygon, and then selecting a contour line layer.
In the vector output, the smooth contour lines will be approximated using polygonal curves (with some fixed precision). The elevation of each contour line is stored in a field Height.
An exception is export to the DXF format, as this format supports smooth curves. In DXF export, the smooth contour lines are preserved, and the elevation is stored as the z-coordinate of each vertex.
Relationship to workspaces
Contour edits let you edit the terrain inside a workspace using contour-line based tools. Since they need to be easily editable, these contour lines often look slightly different from the precomputed contour line layers. The format of contour line edits exported from a workspace is also different from contour lines you download from a contour line layer.
The provided contour line layers are computed from the raw elevation data without buildings. It is not currently possible to compute contour lines for a workspace after your edits have been applied.