About – What's New
Simpler, more powerful downloads
We have made some updates to the way you download data and analysis results from SCALGO Live. Most notably, we have moved the file format and projection controls to the menu that appears after you have selected the layer you want to download, and we only show options relevant for the particular layer. This makes downloading easier if those details are not important to you. The update also includes new download features.
New features
We have also added new download options.
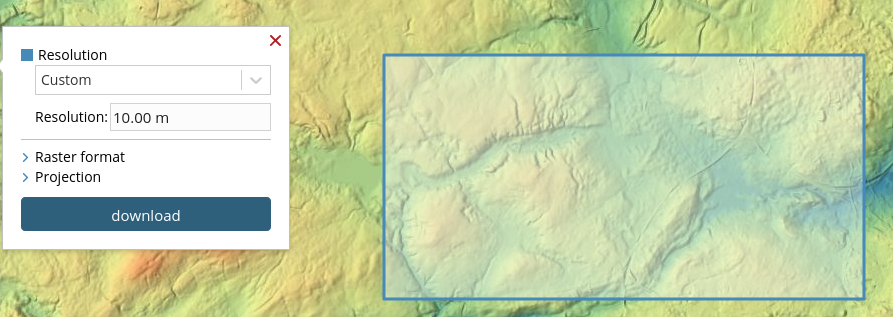
Lower resolution elevation model downloads
For many workflows external to SCALGO Live, the normal high-resolution elevation model available nationwide in SCALGO Live is too big to handle. You can now choose a resolution when you download, and the layer will be down-sampled to this resolution.
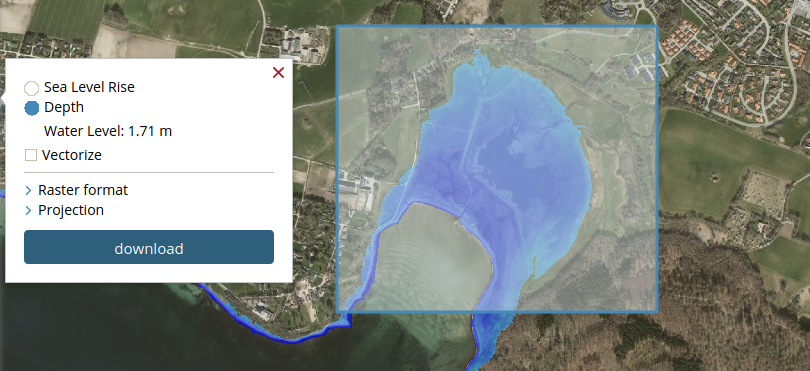
Download water depth for a particular sea-level rise event
Need to know exactly how high the water column on a cell is for a sea-level rise of e.g. 2 meters? You can now download a water depth raster for a particular sea-level rise.
Updates to the Danish elevation model
Since the Danish elevation model is partially updated every year, it is often important to understand when the data for a particular area was collected. To that end, we have added a layer, based on data from SDFE, showing the composition of the Danish elevation model (DHM). You can use the point query tool on this layer to get more information about the acquisition time for a particular area. The layer is available in the Elevation category in the library.
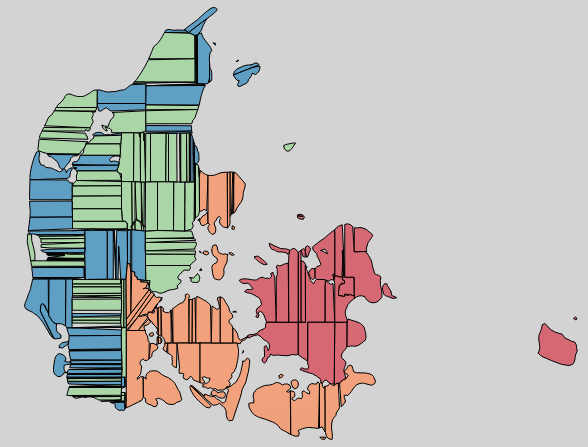
Alongside this change we have renamed the Danish analyses layers to simply "Denmark" to underline the fact that it does not make sense to attribute a single year to the model. As always, we will continue to update our analyses as the model evolves, to ensure you are always looking at the newest data.
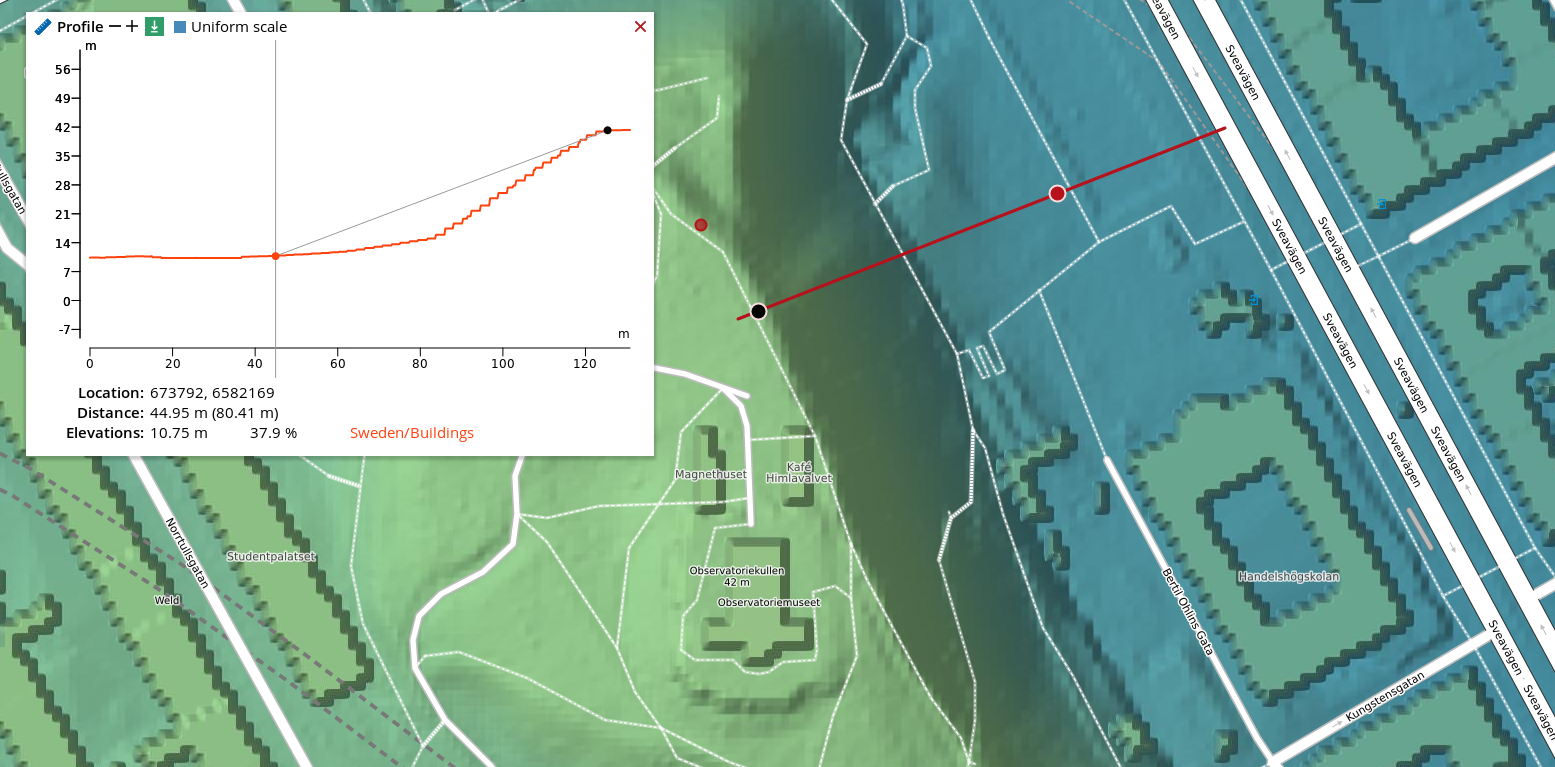
Customize Layer Transparency
It is now possible to tweak the opacity of layers in SCALGO Live. Access the new setting through the gear menu on the layer. Naturally this also works when you generate links to SCALGO Live or when you export a map. The transparency setting can be used for a variety of things, including:
- Slope-dependent shading on your orthophotos so you can more easily get a feeling for local topography.
- Getting elevation profiles without having the elevation layer visible on the map.
- Make analysis and information layers, such as watersheds and landuse, transparent to see or accent information in layers underneath them.
We have made a little video that shows these examples:
Georeferenced maps
We have added georeferencing to PDFs exported through our export map feature. This means that the map can be correctly positioned when opened in GIS or other software packages that support georeferenced PDFs.
Hydrological corrections and new data in Sweden
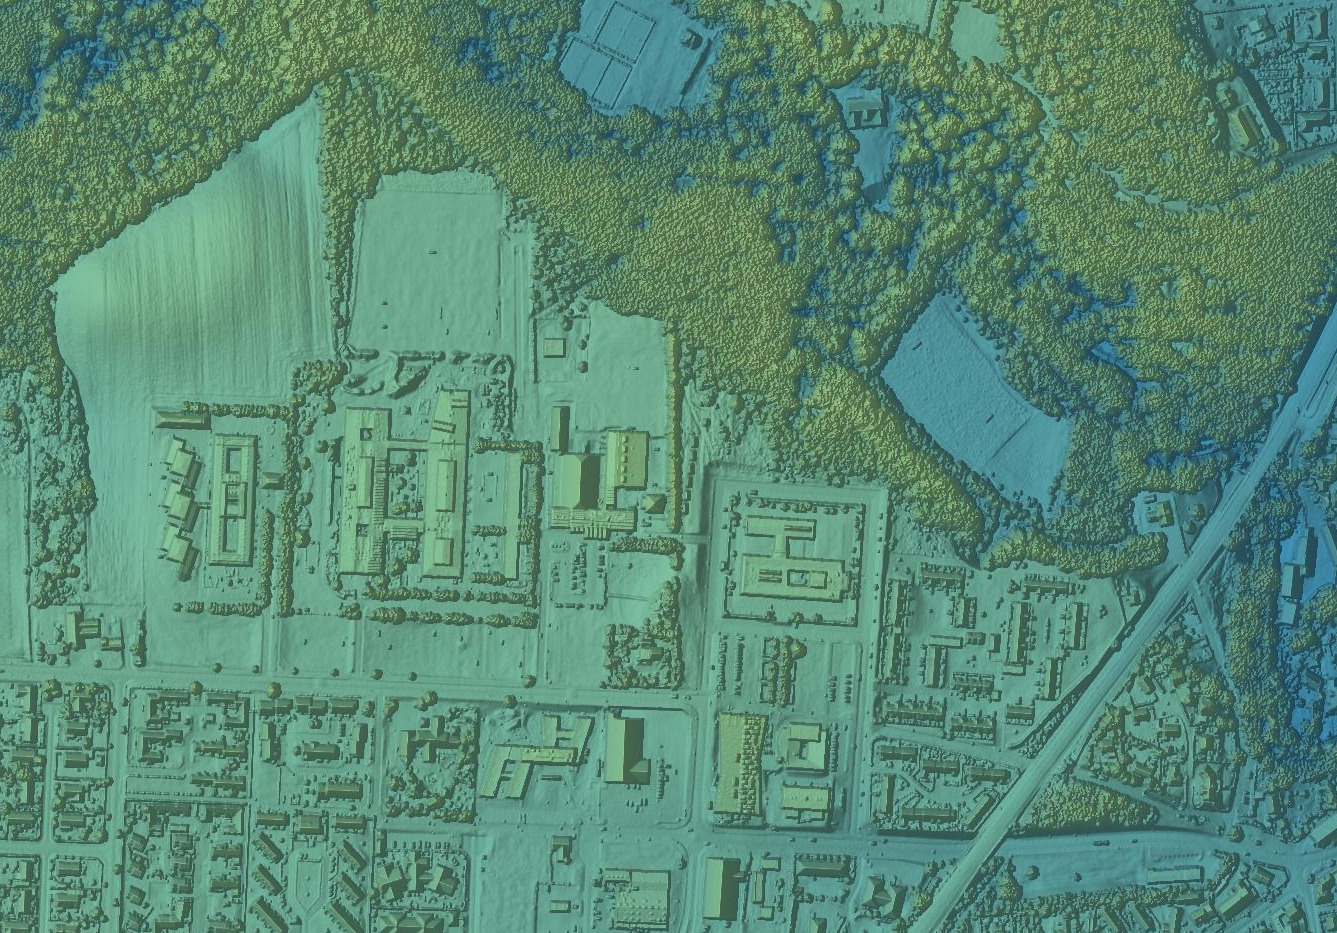
We have updated SCALGO Live in Sweden with new elevation data and buildings from Lantmäteriet. While updating the elevation data we have introduced more than 1 million hydrological corrections that improve the description of flow paths through culverts or under bridges across the country. We also added a range of new data sets that have been requested by users. This is our biggest update for Sweden yet. We hope you enjoy it. Read more below or in the manual.
Hydrological corrections
Bridges, culverts and other structures, where water is transported below the surface of the terrain, are not represented in a traditional digital elevation model. When analysing elevation models, bridges therefore act as dams creating spurious depressions and missing culverts fail to transport water creating erroneous flow paths. Hydrological corrections supplement the elevation model by representing the subsurface flow paths of culverts and bridges. This update of SCALGO Live includes a new nationwide hydrological correction data set that SCALGO has created using advanced algorithms and Machine Learning techniques together with Lantmäteriet's nationwide elevation model and data about rivers and streams.

Conservative corrections
The conservative corrections have been generated at locations where streams and rivers intersect railroads, roads, dams, weirs, or buildings, as well as invisible river sections where the river e.g. runs through a longer covered/piped area. The river network used for generating the corrections comes from Lantmäteriet's Hydrografi Nedladdning and the new corrections are therefore reliable up to the standard of Hydrografi Nedladdning. These corrections are automatically included in new workspaces and are also used in the national analysis available in SCALGO Live.
Comprehensive corrections
We have also developed a new Machine Learning technique that predicts where hydrological corrections exist with high probability. The result is a nationwide set of suggested corrections with an unprecedented coverage. They are not automatically included in the national analysis or workspaces, they are suggestions that can be imported into a workspace on request and checked by the user. We believe this has the potential to save a lot of time when setting up a new workspace by avoiding the time consuming task of manually creating all hydrological corrections.

New data sets
Fastighetsindelning Visning
The cadastral map from Lantmäteriet has been added. The data set is provided as WMS, meaning that changes to cadastral borders are incorporated on a daily basis.
Ortofoto Visning
The latest orthophoto products from Lantmäteriet have been added. The available orthophoto resolutions are now 16 cm, 25 cm, 40 cm and 50 cm. Orthophotos will be served as WMS, meaning that changes and updates of orthophotos are incorporated on a daily basis.
Hydrografi Nedladdning
The most highly detailed data set of the Swedish river network ever produced. The data set contains a national coverage of all streams, standing water bodies, wetlands, dams and more in a scale of 1:25 000. It is available for use in SCALGO Live and for download.
GE.Jordarter 1:25 000-1:100 000
SGU's Jordarter 1:25 000 - 1:100 000 has also been made available as an INSPIRE data set. We have collected and organized the data into one unified national data set available for use in SCALGO Live and for download.

Improved export functionality
We have made improvements to the way you export maps from SCALGO Live to a PDF document or an image, it has never been easier to produce cool and informative maps for your reports and presentations. You now choose exactly what you want in your map by drawing a rectangle directly on the map. Furthermore, the default state of the tool has been simplified to remove advanced options. If you are interested in more control over the size, scale or resolution of the exported map, you can switch to advanced mode where you can e.g. choose to export a print-quality A4 document in landscape mode.
Furthermore we have bundled the tool with the download tool under a new "Export" heading. The previous generic "Actions" menu has been replaced with a "Help" menu, making it easier for you to get help on using SCALGO Live.
Profile and land use/soil type exports
Exports from the profile window, or exports of watershed land use or soil type information from the watershed tool are now available in Microsoft Excel's xlsx format by default, removing the hassle of dealing with CSV files. Should you require a CSV file, you can change the default export type in your account dashboard.
Danish surface model
We have added the Danish Digital Surface Model (DSM) to SCALGO Live and it is available for workspace use as well as download. The DSM includes vegetation and buildings, whereas the regular elevation models available in SCALGO Live (used for hydrological computations), try to capture the bare earth elevation and to this end do not have vegetation and buildings.
You can find the new layer alongside the other elevation models in the library.
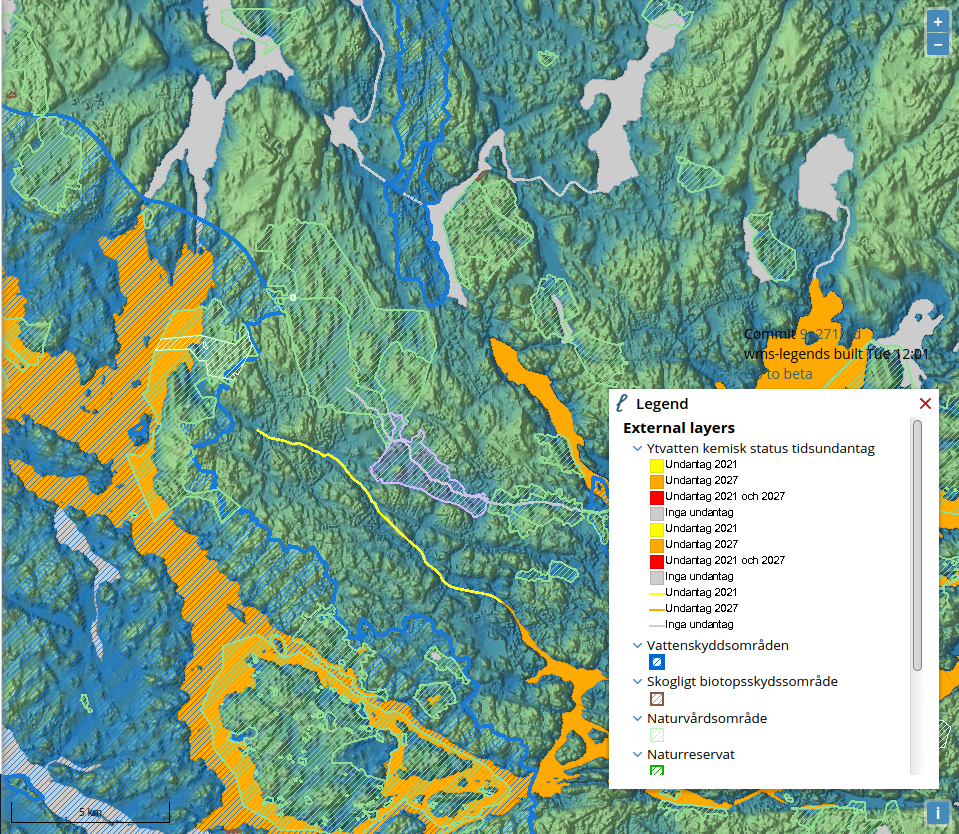
Access a wide range of authorative data inside SCALGO Live
With the latest update of SCALGO Live we have added a number of additional layers to SCALGO Live, and given you the ability to add even more. These layers are made available (hosted) by various government agencies and we are rendering the data directly as it comes from their servers.
Denmark
We have added data from Danmarks Arealinformation, Danmarks Miljøportal, Plandata, GEUS and SDFE.
Sweden
We have added data from Vatteninformationssystem Sverige, Naturvårdsverket, and Länsstyrelserna.
Norway
We have added data from Miljødirektoratet, Kartverket and NIBIO.
You can find the extra layers in the library. Where possible, we show you the legend for the data you are seeing and we also support using the point query tool to query individual features in the layers.
Note that these layers are not served by SCALGO, they are often significantly slower to render - and may not render on higher zoom-levels.
Add your own layers to your organisation
Organization administrators can now add additional layers (from WMS services) through the dashboard. Layers added in this way will be visible to your entire organization and is a good way to expose internal or external data that is particularly relevant to your organization.
Importing VASP data
SCALGO Live now supports importing centerlines and cross-sectional geometry for rivers and streams from VASP, a Danish stream management software from Orbicon (now WSP). When imported, the stream data will be represented as a normal workspace terrain edit that carves out the river in the terrain model. After importing the stream you can continue to edit the river itself by changing the cross sections or the centerline, you can of-course also change the surrounding terrain by adding dikes or other terrain features using the normal terrain editing tools in SCALGO Live.
Video demonstrating the VASP import process (in Danish).
Orbicon (now WSP) has prepared a document that describes how to export the data from VASP.
For more information see press release (in Danish).
Measure gradients, undo edits, and Norway updates
We recently introduced the ability to measure the exact gradient of your workspace edits. We have now expanded this to give you the ability to measure the gradients of features directly in the elevation model, an oft-requested feature. To use, simply use the measure tool to get a traditional elevation profile, right click in the profile window and select the option to measure gradients from the context menu.
Undo/redo of workspace features
Also new in this release is the ability to undo/redo changes to workspace elevation edit features. You can simply use the new buttons in the workspace tools menu.
Updated Norway Analysis
We have updated the Norway computation with new elevation data and buildings from September 2019 from Kartverket/Geovekst. For more information about the Norwegian elevation model please consult the documentation.
New terrain edit features, soil balance information and much more...
This new release includes several new features, including an extension of the terrain edit features that allows you to make even more realistic terrain editing, and new workspace information about how much soil you have added and/or removed while editing the terrain. Read more below.
Cross sections of terrain edits
There are now three different ways of specifying cross sections of terrain edit features.
- The standard boxy cross section where a cross section has a width and is drawn with vertical sides. This is the standard cross section type in SCALGO Live.
- Cross section defined using slide slopes with fixed user-specified gradients. This is e.g. useful for specifying river cross sections from idealized cross section specifications and for specifying simple side slopes of e.g. roads and dikes.
- New in this release, fully controllable cross sections allow you to control the exact cross-sectional geometry of your terrain object. Use this new feature to e.g. design more accurate road surfaces, dikes and riverbeds.
New in this release is also the ability to chain multiple terrain edits together to seamlessly switch from one cross section to the next in a longer trace. You can also right click to insert a new cross section at any point on a selected feature and delete other cross sections. See the video below for a demonstration of some of the new possibilities.
For more information about the new options, please consult the manual or contact support.
Demonstration of the new ability to fully control the cross section of your terrain edit.
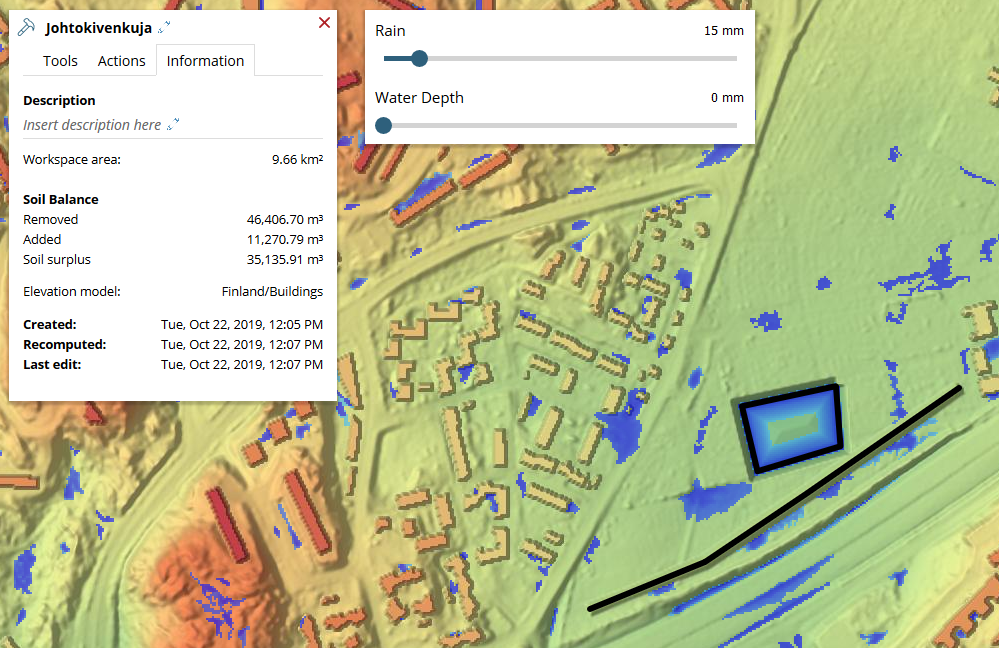
Soil balance
For many projects it is interesting to know how much soil must be added or removed from the project site. We now provide a workspace-wide total of how soil was removed and added to the workspace using terrain edits.
Download depression map
We have made it possible for you to download the depression map directly to easily get the extent and volume for any depression in the elevation model. The depression map can be downloaded as a set of polygons delimiting the extent of each depression, each polygon is annotated with the volume of its corresponding depression.
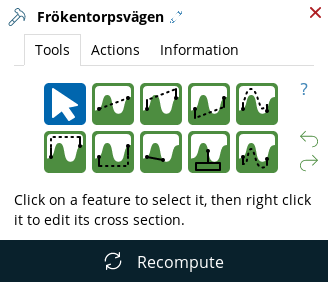
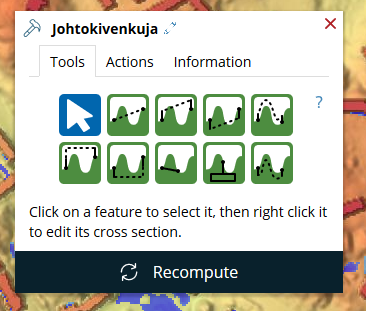
Workspace redesign
We have launched a slight redesign of the workspace dialog to put the terrain edit tools front and center. To do this we have added three tabs; The Tools tab contains all the terrain edit tools and will be selected by default when opening the workspace. The Actions tab contains the other actions you can perform in a workspace that are not related to terrain editing e.g. share or duplicate workspace. The Information tab contains information about your workspace such as time of creation, which terrain model the workspace was created from and the accumulated soil balance of the terrain edits.
If you have made changes to your workspace that requires you to update the analyses in the workspace, we now display a big recompute button to remind you to do so. Once the workspace analyses are up to date, the button disappears.
Cadastral maps in Finland
Cadastral maps are now available for Finland and will be updated weekly. They can be found in the library (click the Add button at the bottom of the layer list). Also, the numeric codes used in the buildings dataset that are shown when doing a point query are now converted according to the specification from Maanmittauslaitos.
Browse historical orthophotos in SCALGO Live
The Danish Agency for Data Supply and Efficiency (SDFE) recently released historical ortophotos for a range of years, dating back to 1999. We took this opportunity to revamp the orthophoto experience in SCALGO Live. You can now find the "Aerial 1999 - Now" ortophoto in the Aerial category. The layer lets you pick the year of interest through a simply slider, making it easy for you to explore how an area has changed in the past twenty years.
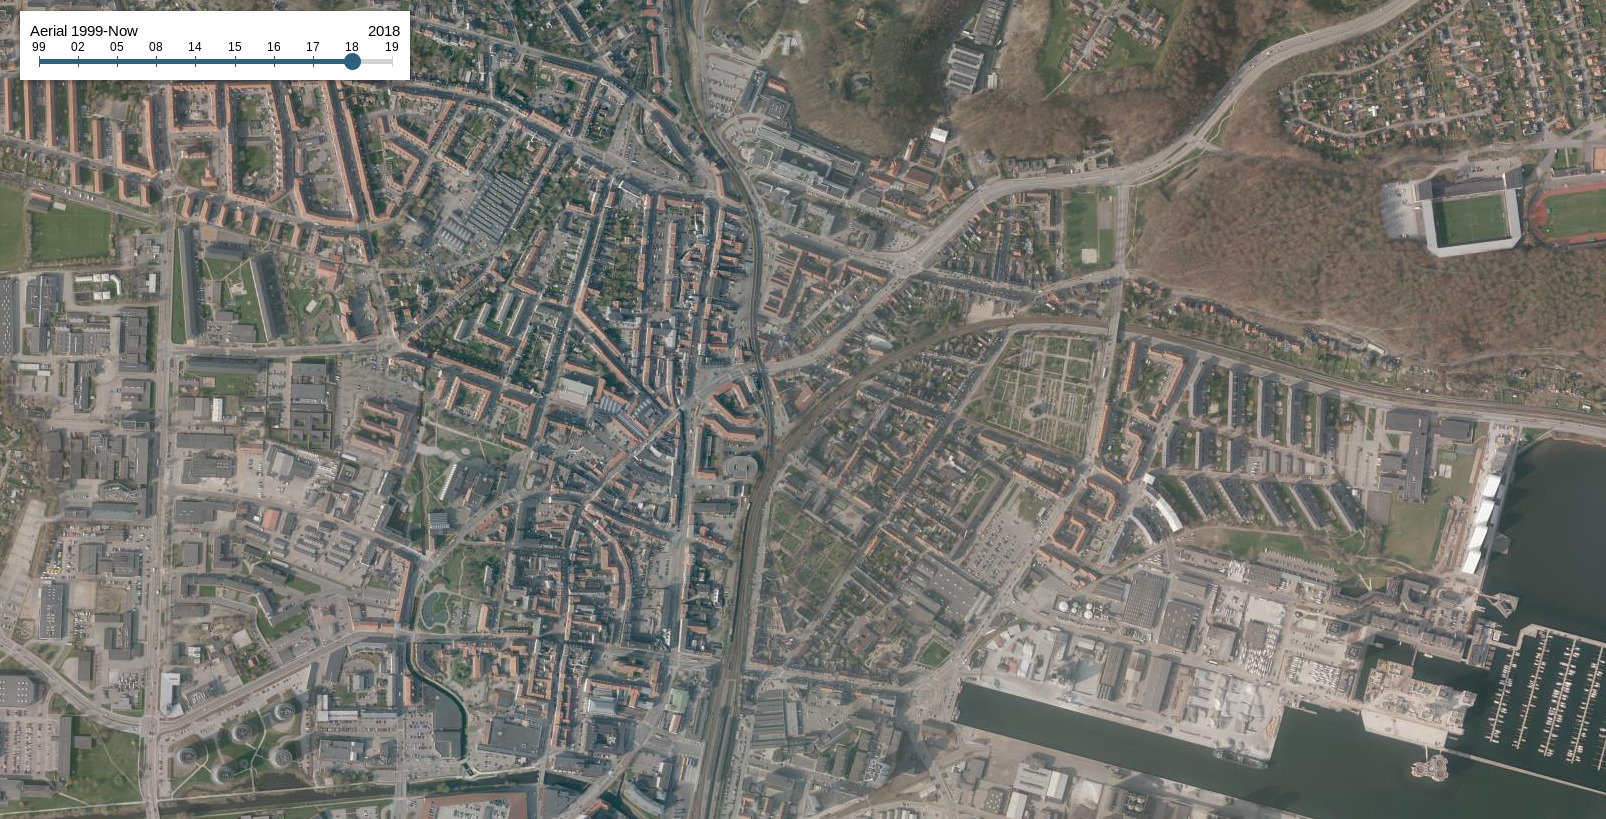
You now also have access to the new orthophotos from 2019. They are still in the process of being finalized and SDFE therefore include a disclaimer in each individual orthophoto-tile.
Most of the newer orthophotos (including 2018) are hosted directly by SCALGO and are available for download in SCALGO Live as usual. The 2019 orthophotos will be available for download when they have been officially released.
Emergency planning with sea-level rise from national forecast data
In collaboration with the Danish Meteorological Institute (DMI) we are proud to launch a truly unique analysis in SCALGO Live. We have coupled our traditional sea-level rise analysis with DMI's national sea-level forecasts. When you enable the new layer, which you can find in the Forecasts category in your library, a slider shows up that allows you to pick a particular point in time and see the effect of the forecasted sea-levels for that time. The DMI forecasts go 5 days into the future.
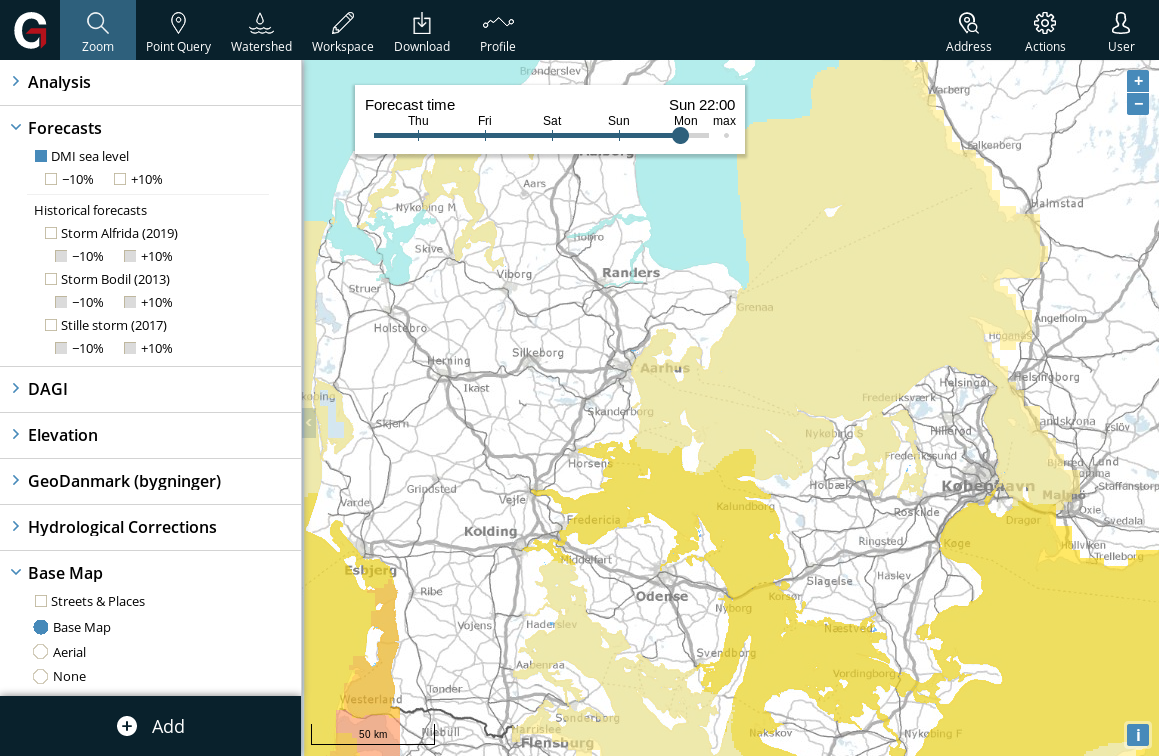
The analysis is incorporated into workspaces and is enabled when you create a workspace for Sea-level rise. We also have a sensitivity analysis to allow you to take the uncertainty in DMI's forecast into account. According to DMI, the uncertainty in the forecast is 10%. Therefore we have added checkboxes "-10%" and "+10%" that allow you to view respectively the areas that would not be flooded if the forecast was 10% lower, and the areas that would be flooded if it was 10% higher.
Since a severe increase in sea-level is not an everyday event (luckily) we have added the forecasts from three historical events: Bodil (2013), Alfrida (2019) and "Den stille storm" (2017). These work in the same way as the current forecast and allow you to experience how the system would act if a similar event was to appear in the current forecast.
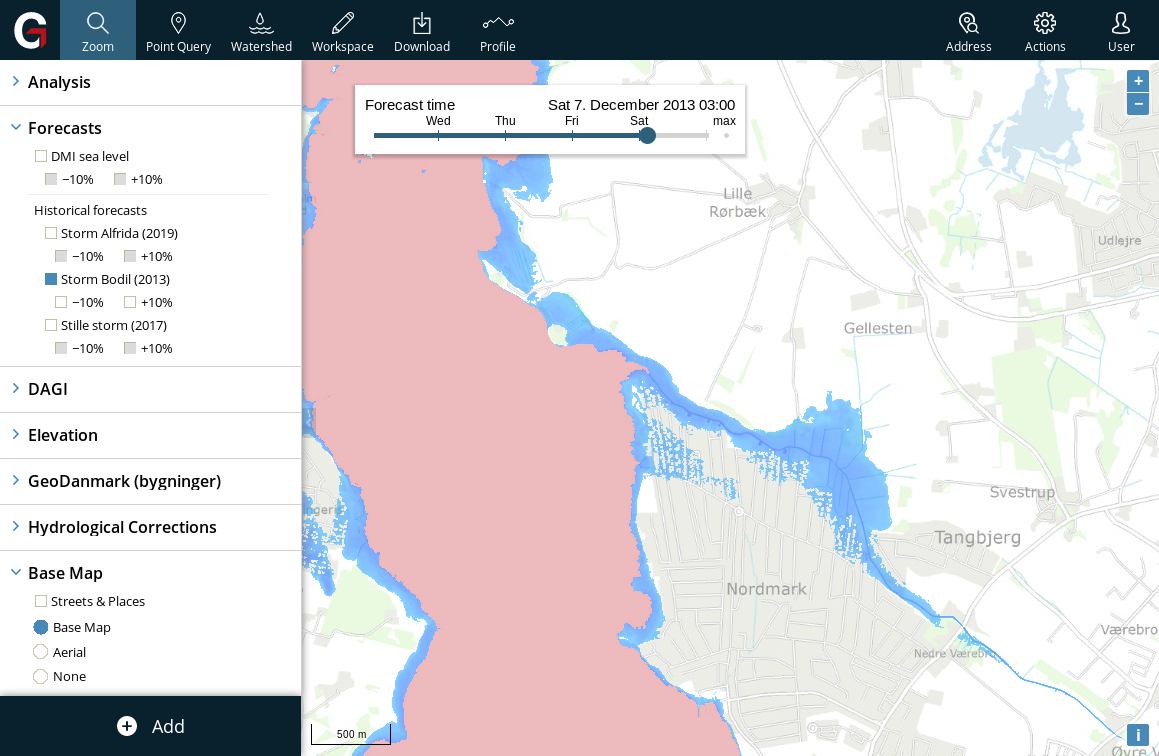
This new feature allows emergency response teams to easily show the in-land consequences of DMI forecasts for communication with the public and for planning. In the latter case, mobile barriers, sand bags and other remedies can be placed and their effects assessed quickly and intuitively through workspaces.
You can read more about the new functionality in the manual.