-
Documentation
-
About
- Use Cases
- Support
-
What's New
- Simplified tools for designing with contour lines
- DynamicFlood: Organize and understand your computations
- Modelling stormwater networks in Scalgo Live
- National US high-resolution land cover map
- New functionality for CAD users!
- DynamicFlood: Cleaning up rain events and adding historical rains, now available in France
- National Polish high-resolution land cover map
- DynamicFlood now available in Great Britain
- Global contour maps now available
- Updated Swedish topsoil map
- Scalgo Live Global theme is updated with new elevation and land cover data
- Detailed culvert information in DynamicFlood
- No more Lantmäteriet fees for Swedish data
- Depth-dependent surface roughness (Manning) in DynamicFlood
- Detailed land cover map for all of Great Britain
- National French high-resolution land cover map
- Work with multiple features simultaneously in the canvas
- Spill points on flash flood map and depression map
- New surface roughness (Manning) parameters for DynamicFlood
- Workspace and Modelspace sharing updates
- Regionally varying rain in DynamicFlood Sweden
- Veden imeytyminen nyt osana rankkasadeanalyysejä
- Use Scalgo Live anywhere in the world
- DynamicFlood: Live model speed info and regionally-varying rain events
- Sea-level rise: Download building flooding information
- Detailed contour maps and editable buildings in Workspaces
- New in Modelspaces: Explore hydrodynamic simulations and visualise the dynamics of flow velocity
- National German high-resolution land cover map
- Specify basins and protrusions by drawing their outer boundary
- Simplified path features
- National Norwegian high-resolution land cover map
- Organise and communicate on a digital canvas
- New sidebar to help organize your analyses and queries
- Sliding contours
- Ny skyfallsanalys och en ännu bättre marktäckekarta
- New land cover map for Finland
- Depths in the depression map
- New Danish land cover map with more classes
- National Swedish High-Resolution Impervious Surface Mapping
- Watershed tool updated with even better descriptions of catchment characteristics
- National Flash Flood Map with Infiltration and Drainage for Denmark
- Add your own WMS layers to SCALGO Live
- Enriched building data in Denmark
- National hydrological corrections and Land Cover for Poland
- National hydrological corrections for Norway
- Updated Impervious Surface Mapping for Denmark
- National hydrological corrections and updated local data for Finland
- Fast and intuitive tools to work with infiltration and land use
- Improvements to vector imports and exports
- National Danish groundwater model
- New Sweden high-resolution model
- New powerful depression map and more analyses visualization options
- Introducing Modelspaces: Get your hydrodynamic models into SCALGO Live
- Use case videos
- Access a EA flood maps inside SCALGO Live
- Improved map export
- New powerful ways to edit the elevation model
- Better coloring of flooding layers and sea-level depth filtering
- National Danish High-Resolution Impervious Surface Mapping
- National access for local and regional organizations
- Simpler, more powerful downloads
- Customize Layer Transparency
- Hydrological corrections and new data in Sweden
- Improved export functionality
- Access a wide range of authorative data inside SCALGO Live
- Importing VASP data
- Measure gradients, undo edits, and Norway updates
- New terrain edit features, soil balance information and much more...
- Browse historical orthophotos in SCALGO Live
- Emergency planning with sea-level rise from national forecast data
- Detailed information about watershed composition
- Better styling of imported vector layers
- New Danish Elevation Model
- Work with gradients in the profile widget
- Flood risk screening from rivers and flow paths
- New workspace tool: Raise and lower terrain uniformly
- Importing LandXML TINs, LAS point clouds
- New model in Sweden
- Side slopes on workspace features
- Drag and drop enhancements
- Swedish contour maps
- Subsurface basins and sewage drains in workspaces
- New Interface
- Volume information for watersheds and flow paths
- New powerful tool for emergency response and coastal flood prevention
- Denmark: New flash flood map
- Sweden: Geodatasamverkan setting for Swedish users
- Import custom terrain models
- New Hydrological Corrections
- Elevation contours now available
- Download orthophotos as JPEG and PNG
- Subsurface structures in workspace
- Sea-levels in terrain profiles
- Updated orthophotos
- Models and analysis update
- User interface updates
- User interface updates
- GeoDanmark/FOT data, Matrikelkortet now available
- New flash flood map
- Download of risk polygons
- Updated orthophotos
- Nationwide hydrology on the new DHM/2015 model now available
- New flash flood map computation available with watershed download
- DHM/2015 variants and sea-levels now available nationwide
- DHM/2015 now available nationwide
- Hydrology on the new DHM/2015 model now available
- New DHM/2015 Model - now with buildings
- New DHM Model
- Watershed Tool
- Ad hoc layers
- Nationwide contour maps for all countries
- Single Sign-On
- Data Fees
- User Interface
- Canvas
- Analysis
- Workspaces
- Modelspaces
- Working with CAD Data
- Core+ DynamicFlood
- Core+ NatureInsight
- Core+ PropertyResilience
- Streams and Flow
- Physical Properties
- Country Specific
-
About
Canvas – Importing and Exporting Canvas Data
Your canvas is not just a thing that lives by itself inside SCALGO Live. There are powerful ways of integrating data from the wider SCALGO Live ecosystem into your canvas, and you can also import external GIS data into your canvas. Furthermore, you can easily export your canvas in a number of different ways.
For high-level information about the SCALGO Live Canvas, please consult the product page. Some of the topics on this page are also referenced in the canvas getting started video.
You can get data into your canvas through point queries and watershed queries, and through the download tool. Make sure you activate the canvas you want to work with before continuing.
Point query
When you use the point query tool on certain objects, you will get an "add to canvas" button that allows you to add the selected object directly to the canvas. You can do this on:
- Depression-Free Flow, Flow Accumulation: Adds the flow lines upstream of the query point with a flow value higher than the flow threshold slider setting - that is, the flow paths currently shown on the map. Use this to extract important flow paths from the terrain.
- Depression Map, Depressions: Adds the part of the depression that is below the query point, corresponding to the highlighted part of the depression on the map.
- Flash Flood Map, Flooded Areas: Adds the flooded extent of the depression at the current rain event as set by the rain slider.
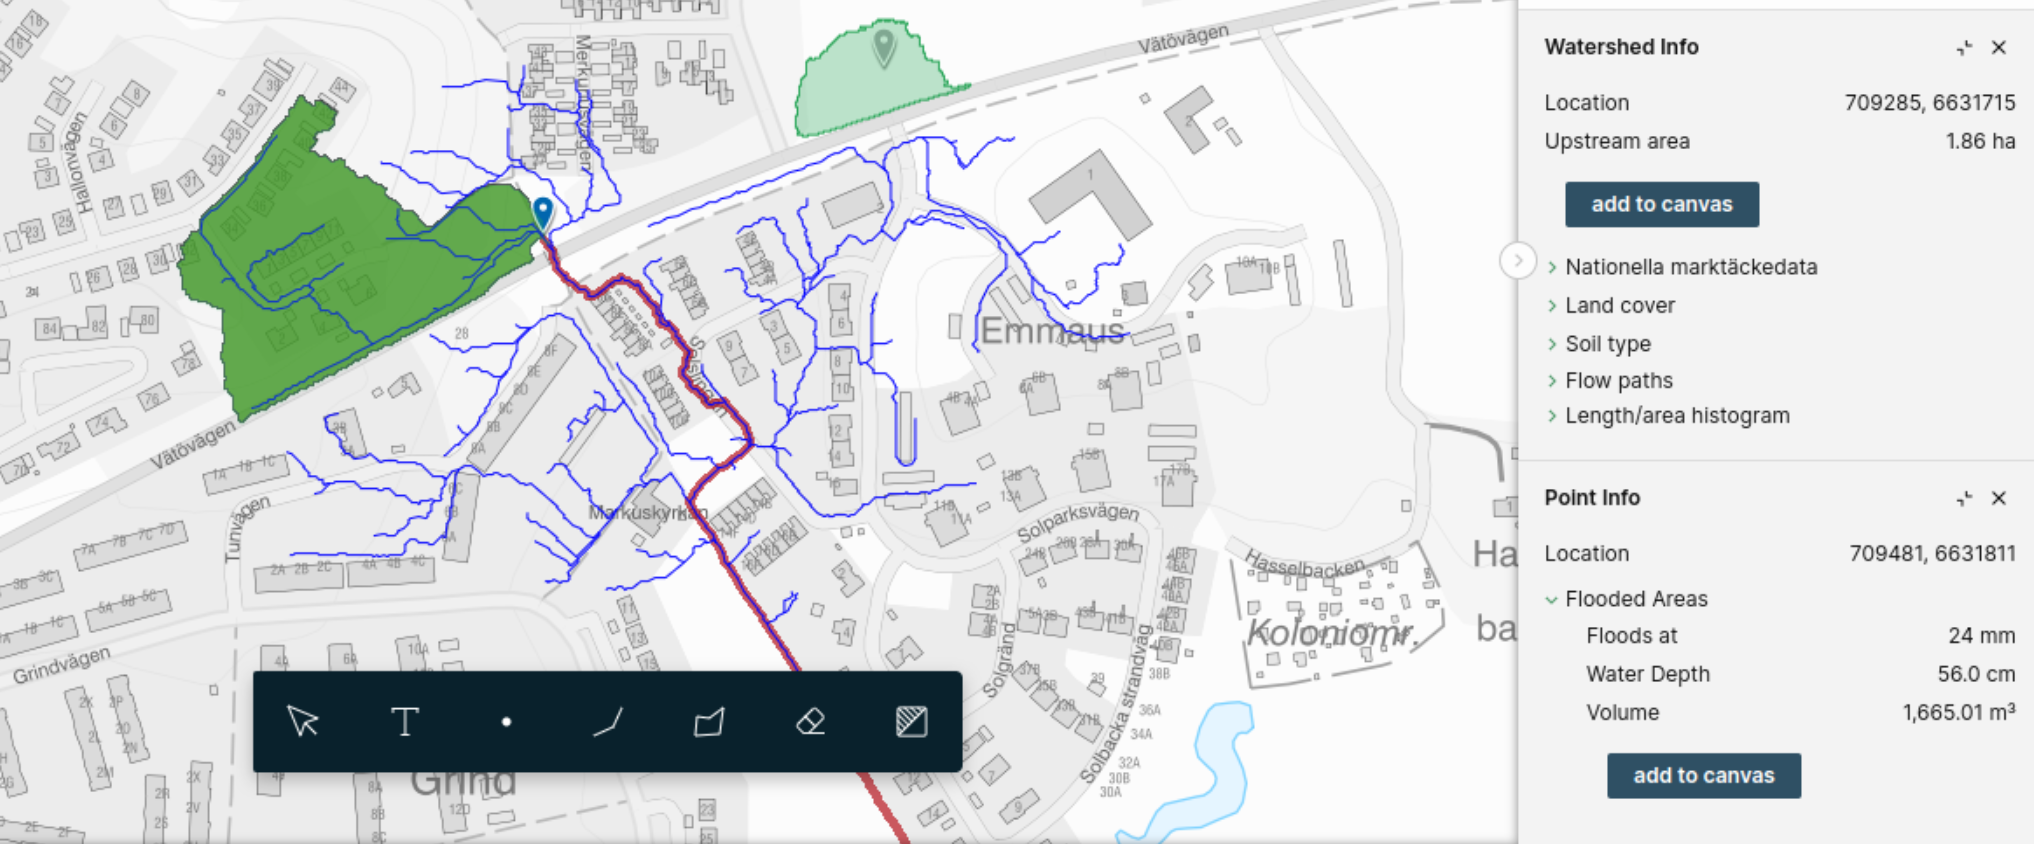
If you are not seeing the add to canvas button, make sure you have an active canvas.
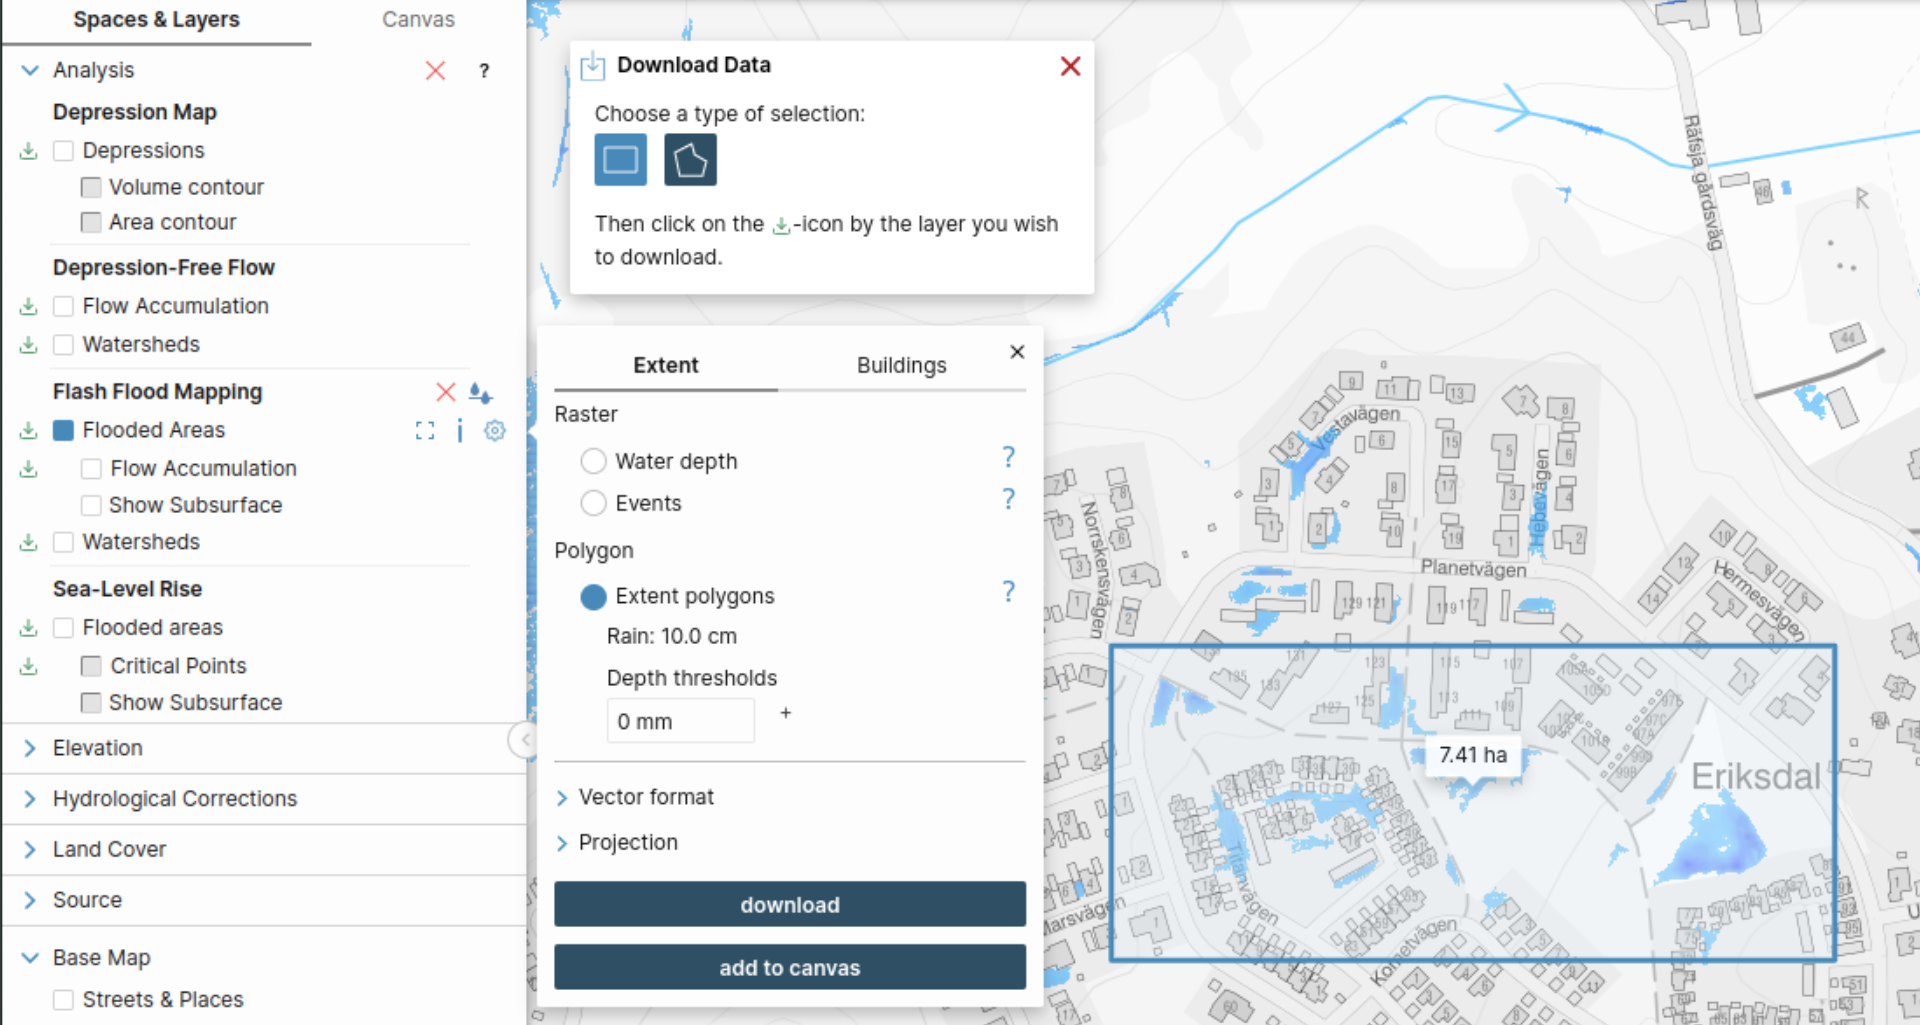
Download tool
Data from many of the layers and analyses in SCALGO Live can be added directly to the canvas through the download menu. In general, if the layer download type is a vector, it can be added to the canvas. To try this out do the following steps:
- Make sure you have an active canvas
- Activate the download tool (Export->Download Data)
- Select your download area
- Select the download icon next to the layer name
- Click the "add to canvas" button (only available for vector data)
Once the objects have been added to the canvas, you can select them in the canvas object list and change their style (colors etc.).
If you are not seeing the add to canvas button, check if you have an active canvas.
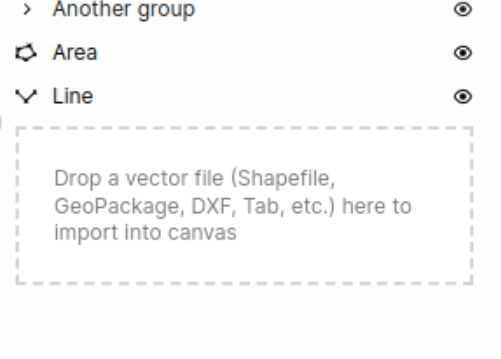
If you have GIS data in one of our supported vector formats you can drag this file directly into the canvas object list in the right sidebar. You can also click inside the drop area to select a file directly.
You can export the canvas in a couple of different ways:
Export map
You can use our export map functionality to create a rendering of the canvas. If you choose the PDF format you will get a georeferenced PDF, supported by some GIS (e.g. QGIS).
Download object geometries
You can download the geometries of the objects in a canvas using the download button in the canvas tab in the left sidebar.
Apart from the standard formats available elsewhere in SCALGO Live, canvas also supports exporting to KML, preserving as much visual markup as possible, as well as the folder structure and naming of objects. Text boxes are exported as i icons that can be selected in e.g. Google Earth to show their content with full markup.
Use a web service
You can access the geometries of the objects in a canvas using the OGC API - Features, an open web standard. You access this through the canvas settings: click the cogwheel next to the canvas title in the left sidebar, then click Web service -> Get OGC link. (Note that to use the endpoint, you must have a token which you can generate through the account panel.) Consult your GIS for information about how to integrate using OGC API - Features. For your convenience here is the documentation for QGIS and ArcGIS Pro. Note that the endpoint exported for a canvas is read-only, we do not support editing features through the web service.
Note that both download and the OGC API - Features allow you to access the raw geometry of the objects in a canvas, with information about colors and styles as fields on the vectors. Text boxes are single geometries with the text available as a field. Thus, these options are not suitable for getting the same graphical representation of the canvas that you get in SCALGO Live, for that you need to use the export map option.