Country Specific – Norway
Quick Facts NDH DTM1
| Cell Size | 1x1 m |
| Coordinate System | ETRS89 / UTM 33N |
| Vertical Reference | NN2000 |
| Flight Years | 2016–present |
Our elevation model of Norway is based primarily on the DTM1 data made available by Kartverket's nasjonal detaljert høydemodell (NDH) project, and has a grid resolution of 1x1 meter. The project started in 2016 and currently covers most of Norway. More data is being acquired continuously. We strive to keep our model up to date with the latest sources.
In order to use an elevation model for hydrological analysis such as watershed and flow accumulation computations, two primary conditions need to be met:
- The upstream area of any river should be covered by the elevation model.
- Structures on top of the terrain should only be present in case they actually block water from flowing under or through them.
Below, we discuss how we process the model to fulfill these conditions as well as possible.
Extensions
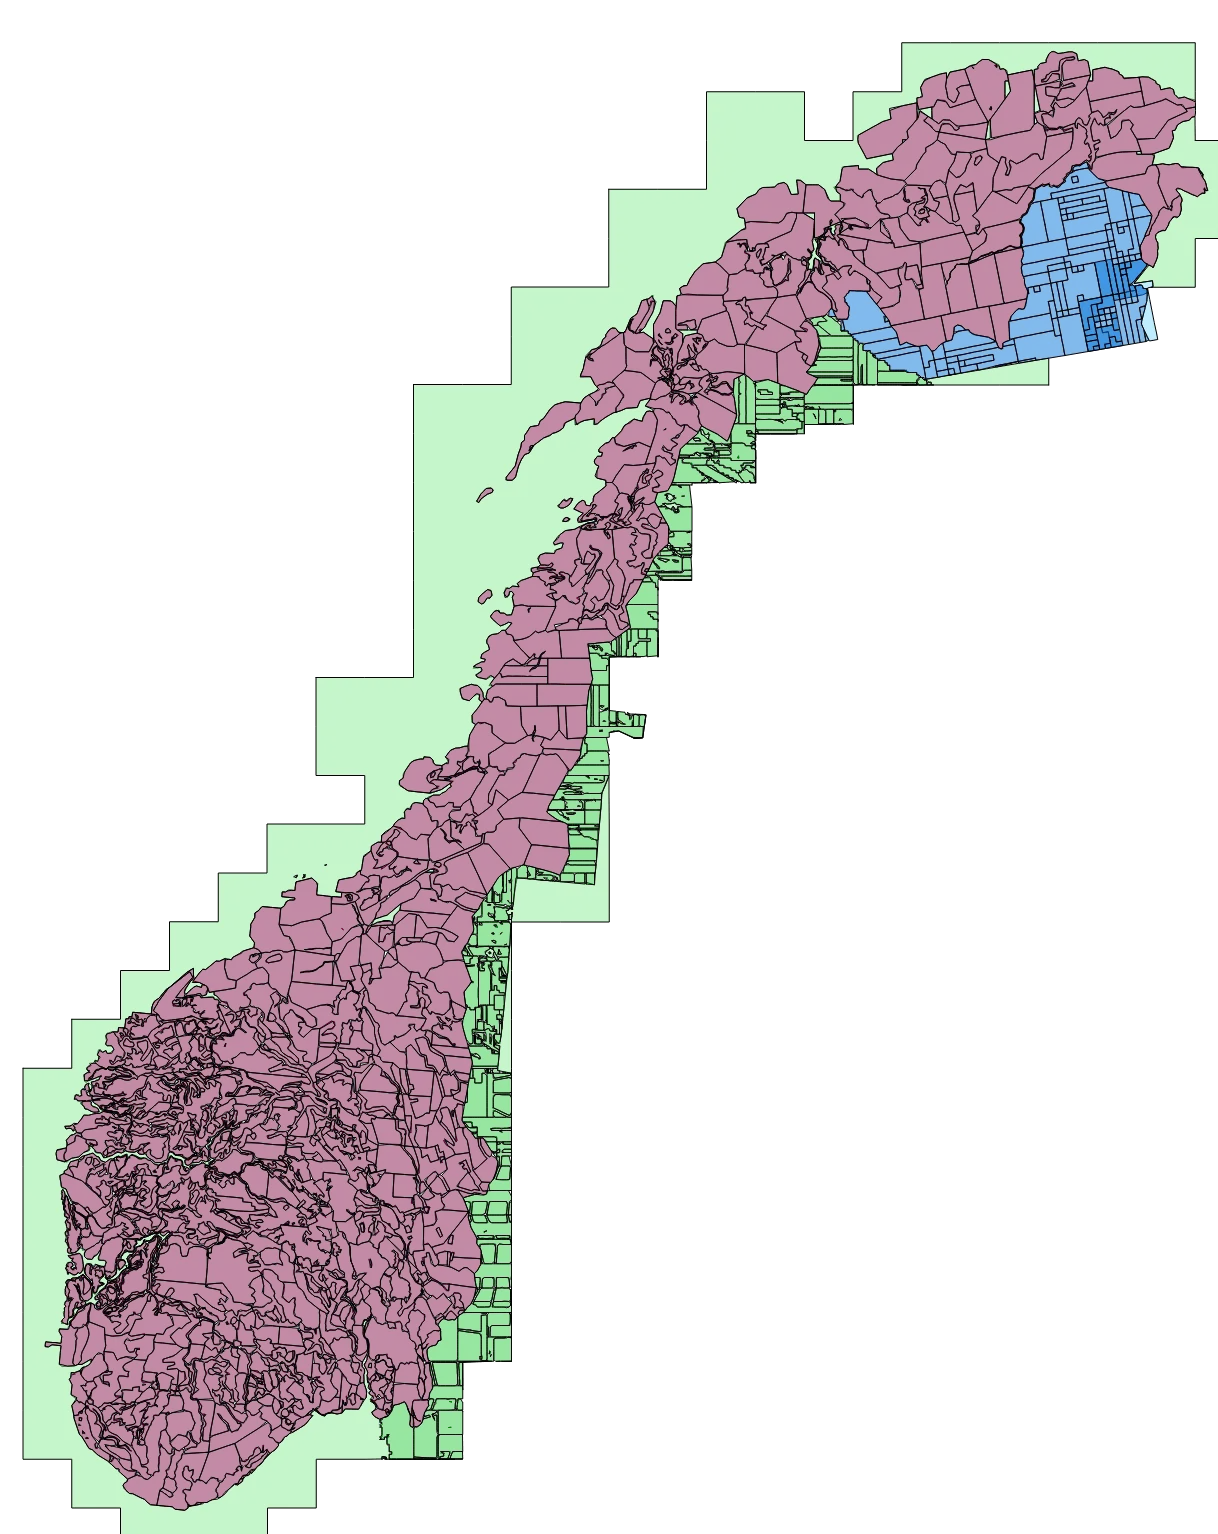
In order to cover all of Norway including upstream areas of all rivers, we have extended the DTM1 model in the following areas:
- For Sweden we use Lantmäteriet's Markhöjdmodell Nedladdning, grid 1+. In the figure below, this area is highlighted in green.
- For remaining areas of Norway and Sweden not covered by the NDH/DTM1 data, we have used the Kartverket's DTM 10 data set from 2013 (light green).
- To cover the upstream area of the Tana and Neiden rivers (Finnmark), we have included parts of the national Finnish elevation models:
- Lantmäteriverket's Höjdmodell 2m (dark blue in the figure below)
- Lantmäteriverket's Höjdmodell 10m (light blue)
A full overview of which data source is used for which part of the model
is available by clicking the gear icon next to an elevation layer, selecting the "Source" tab, and "Show source information". Use point query to see more details for individual areas as provided by Kartverket. Multiple styles are available for this layer to colour sources by e.g. collection date.
Buildings
Apart from vegetation and major bridges, also buildings have been removed from the terrain model during construction. When computing water flow paths, more realistic results are generally obtained when the elevation model includes buildings as water can be simulated to flow around them. In Scalgo Live, we accomplish this by adding buildings back into the model using a data set of building footprints,. Here, we raise all grid cells covered by a building to a height of 10 m above the highest terrain point within the building footprint. This model is called Terrain/Buildings and is the basis for all nationwide hydrological computations.
The building footprint data set used is the FKB N5 Bygning data set from Kartverket/Geovekst.
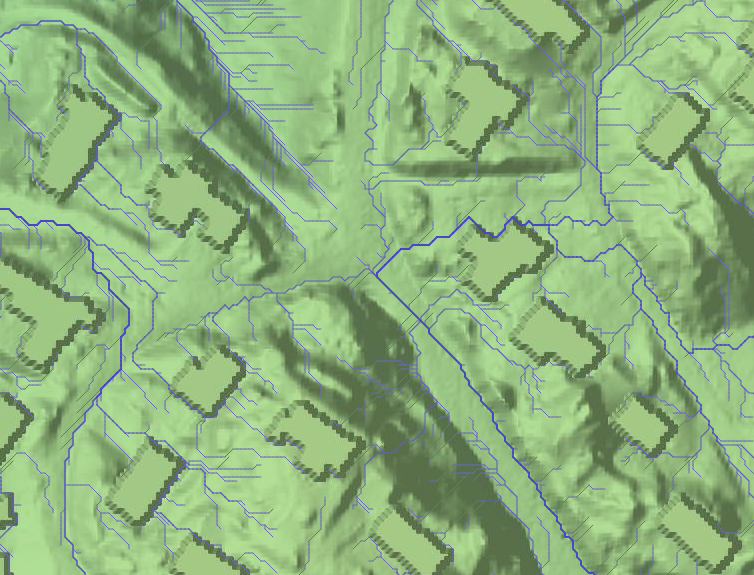
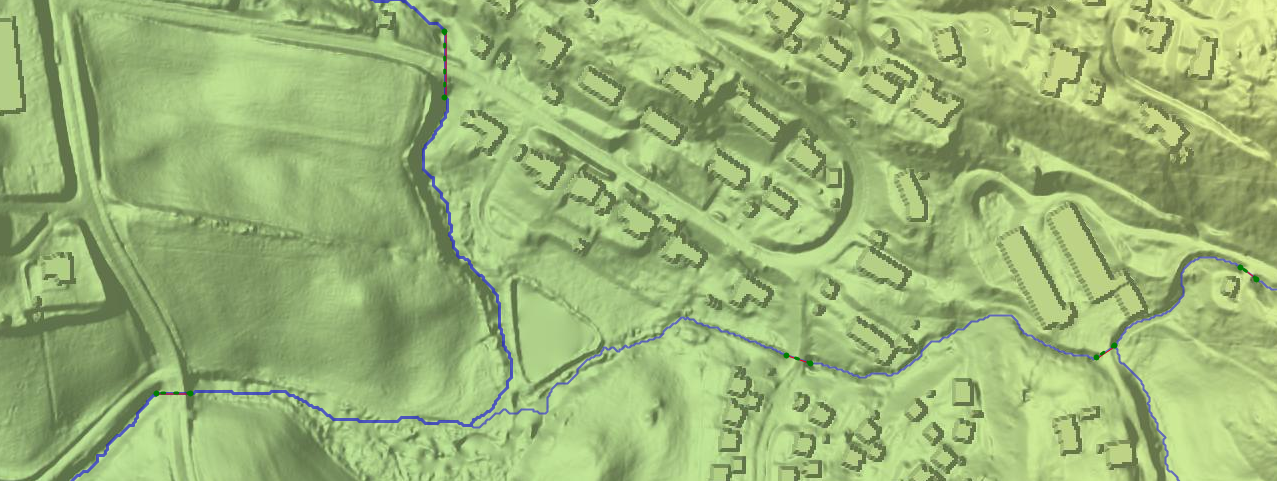
Bridges, underpasses and hydrological corrections
Major bridges have generally been removed from the model, but for many smaller bridges and underpasses, additional hydrological corrections that allow water to flow through such structures may be necessary. Scalgo Live Norway includes a nationwide hydrological correction set based primarily on the N20 Vann layer from Kartverket/Geovekst, as well as culverts (stikkrenner) from Statens Vegvesen's NVDB, Elveg 2.0 and the Banenettverk dataset from Bane Nor SF.
Corrections have been generated at locations where rivers intersect roads or railroads, as well as at river sections marked subsurface ("medium=U") where the river e.g. runs through a longer covered/piped area. Secondly, corrections have been generated at road overpasses and tunnels. Thirdly, NVDB's stikkrenner are included.
Each correction thus follows a line in the river or road network, or a known culvert, with end points adjusted to match the elevation model as well as possible. In places where the elevation model is already hydrologically corrected (e.g. at large bridges), corrections are not generated.
This data set is machine-generated, so some errors should be expected. However, since we only include corrections along known river and road lines, we believe it to be conservative in terms of water flow.
The set of corrections is available under the Hydrological Corrections category in the Library.
The national analyses use these corrections, and workspaces created using the predefined "Flash Flood Map" or "Sea-Level Rise" buttons also include them by default. If you create a workspace through any other means than the predefined buttons (e.g. if you upload your own model), you can include corrections in that workspace through the workspace Actions tab by clicking Import corrections, they will not be included automatically.
Land cover
The land cover map in Scalgo Live is produced by Scalgo based on machine learning techniques at a resolution of 25 cm. We refer to the land cover section for more details.
Soil type
Scalgo Live uses the superficial deposits from Geological Survey of Norway for watershed soil type query. NGU's quaternary geological mapping (superficial deposits mapping) shows which type of soil predominates in the upper meters of the terrain surface. Thick and thin layers of other soil types may appear farther down the soil profile. We refer to Geonorge for more information about the NGU source data.
For application in our analyses, we map the NGU soil types to our JB-based soil typology. For more information about this, see the soil type documentation. The initial mapping from NGU soil type to JB-based soil type is shown in the table below.
| NGU name | Scalgo Soil Type |
| 14-Avsmeltningsmorene (Ablasjonsmorene) | Coarse clay with sand |
| 130-Bart fjell | Bedrock |
| 110-Bart fjell/fjell med tynt torvdekke, uspesifisert | Bedrock |
| 140-Bart fjell/fjell med usammenhengende eller tynt løsmassedekke | Bedrock |
| 31-Breelv- og bresjø-/brekammeravsetning (Glasifluvial og glasilakustrin avsetning) | Fine sand |
| 21-Breelv- og elveavsetning | Fine sand |
| 20-Breelvavsetning (Glasifluvial avsetning) | Fine sand |
| 30-Bresjø- eller brekammeravsetning (Glasilakustrin avsetning) | Clay |
| 36-Bresjø-/brekammer og innsjøavsetning (Glasilakustrin og lakustrin avsetning) | Clay |
| 16-Drumlin | Coarse clay with sand |
| 50-Elve- og bekkeavsetning (Fluvial avsetning) | Fine sand |
| 305-Fjellskredavsetning, stedvis med stor mektighet | Gravel |
| 306-Fjellskredavsetning, usammenhengende eller tynt dekke | Gravel |
| 56-Flomavsetning | Clay |
| 53-Flomavsetning bresjøtapning (uspesifisert) | Fine sand |
| 54-Flomavsetning fra bresjøtapping, sammenhengende | Fine sand |
| 55-Flomavsetning fra bresjøtapping, usammenhengende eller tynt dekke over berggrunnen | Fine sand |
| 57-Flomavsetning, usammenhengende eller tynt dekke | Fine sand |
| 71-Forvitringsmateriale | Coarse sand with clay |
| 70-Forvitringsmateriale, ikke inndelt etter mektighet | Coarse sand with clay |
| 73-Forvitringsmateriale, stein- og blokkrikt (blokkhav) | Coarse sand with clay |
| 72-Forvitringsmateriale, usammenhengende eller tynt dekke over berggrunnen | Coarse sand with clay |
| 120-Fyllmasse (antropogent materiale) | Coarse sand with clay |
| 41-Hav- og fjordavsetning, sammenhengende dekke, stedvis med stor mektighet | Clay |
| 40-Hav- og fjordavsetning, uspesifisert | Clay |
| 43-Hav-, fjord- og strandavsetning, usammenhengende eller tynt dekke over berggrunnen | Clay |
| 0-Ikke angitt | Bedrock |
| 35-Innsjøavsetning (Lakustrin avsetning) | Clay |
| 301-Jord- og flomskredavsetning | Fine sand |
| 302-Jord- og flomskredavsetning, usammenhengende eller tynt dekke | Fine sand |
| 315-Jordskred- og steinsprangavsetning, stedvis med stor mektighet | Gravel |
| 316-Jordskred- og steinsprangavsetning, usammenhengende eller tynt dekke | Gravel |
| 303-Leirskredavsetning, stedvis med stor mektighet | Clay |
| 304-Leirskredavsetning, usammenhengende eller tynt dekke over berggrunnen | Clay |
| 1-Løsmasser/berggrunn under vann, uspesifisert | Bedrock |
| 42-Marin strandavsetning, sammenhengende dekke | Fine sand |
| 122-Menneskepåvirket materiale, ikke nærmere spesifisert | Fine clay with sand |
| 13-Moreneleire | Clay |
| 11-Morenemateriale, sammenhengende dekke, stedvis med stor mektighet | Coarse clay with sand |
| 12-Morenemateriale, usammenhengende eller tynt dekke over berggrunnen | Coarse clay with sand |
| 10-Morenemateriale, uspesifisert | Coarse clay with sand |
| 15-Randmorene/randmorenesone | Coarse clay with sand |
| 17-Rogenmorene | Coarse clay with sand |
| 22-Ryggformet breelvavsetning (Esker) | Coarse clay with sand |
| 102-Sammenhengende løsmassedekke av flere jordarter | Clay |
| 80-Skredmateriale, ikke inndelt etter mektighet | Gravel |
| 81-Skredmateriale, sammenhengende dekke | Gravel |
| 82-Skredmateriale, usammenhengende eller tynt dekke | Gravel |
| 313-Snø- og jordskredavsetning, stedvis med stor mektighet | Fine sand |
| 314-Snø- og jordskredavsetning, usammenhengende eller tynt dekke | Fine sand |
| 317-Snø- og steinsprangavsetning, stedvis med stor mektighet | Fine sand |
| 309-Snøskredavsetning, stedvis med stor mektighet | Fine sand |
| 310-Snøskredavsetning, usammenhengende eller tynt dekke | Fine sand |
| 88-Steinbreavsetning | Bedrock |
| 321-Steinrikt, sigende skråningsmateriale | Gravel |
| 311-Steinskredavsetning, stedvis med stor metighet | Gravel |
| 312-Steinskredavsetning, usammenhengende eller tynt dekke | Gravel |
| 307-Steinsprangavsetning, stedvis med stor mektighet | Bedrock |
| 308-Steinsprangavsetning, usammenhengende eller tynt dekke | Bedrock |
| 121-Steintipp | Bedrock |
| 37-Strandavsetning innsjø og/eller bresjø | Fine sand |
| 90-Torv og myr | Gyttja/peat |
| 100-Tynt dekke av organisk materiale over berggrunn | Bedrock |
| 101-Usammenhengende eller tynt løsmassedekke over berggrunnen, flere løsmassetyper, uspesifisert | Bedrock |
| 60-Vindavsetning (Eolisk avsetning) | Fine sand |
Rain events
Design rain events in Norway are based on data from Norwegian Meteorological Institute (MET). MET provides IDF-curves for all stations in their rain gauge network with more than 10 years of observations. We create design rain events from these IDF-curves using the methodology described in the Chicago Design Storm section. We use data only from stations that are still in operation and have a record length of at least 20 years, except for northern Norway, where we ease the length criterion to 10 years due to the scarcity of stations. To indicate the nearest quality approved rain station for any location in the country we create Thiessen polygons around them. A layer showing the resulting rain zones is available in the library (search for "Rain" in the library). The data is regularly updated with fresh data from the measurement stations, use the info dialog for the layer inside Scalgo Live to see when we last updated the map.

The Norwegian rain zone layer inside Scalgo Live. As this data is continuously updated, the layer in Scalgo Live may differ from the content in this screenshot.
Urban and sewered areas
To determine whether an area is to be considered sewered (affecting the fate of all water on artificial surfaces in DynamicFlood) we use the map Tettsteder from SSB - Statistics Norway (can be found in the Library). We assume that all artificial surfaces that fall within a polygon in this map are connected to a drainage system, and that all artificial surfaces that fall outside these polygons are not connected to a drainage system.
We set the maximum capacity of the drainage system in DynamicFlood in Norway to 20 mm/hr. This value was chosen to reflect common historical dimensioning practice in Norway.
To determine whether an area is to be considered urban (affecting some soil types in the topsoil map), we use the same map as for sewered areas.