-
Documentation
-
About
- Getting Started & Use Cases
- Support
-
What's New
- Simplified tools for designing with contour lines
- DynamicFlood: Organize and understand your computations
- Modelling stormwater networks in Scalgo Live
- National US high-resolution land cover map
- New functionality for CAD users!
- DynamicFlood: Cleaning up rain events and adding historical rains, now available in France
- National Polish high-resolution land cover map
- DynamicFlood now available in Great Britain
- Global contour maps now available
- Updated Swedish topsoil map
- Scalgo Live Global theme is updated with new elevation and land cover data
- Detailed culvert information in DynamicFlood
- No more Lantmäteriet fees for Swedish data
- Depth-dependent surface roughness (Manning) in DynamicFlood
- Detailed land cover map for all of Great Britain
- National French high-resolution land cover map
- Work with multiple features simultaneously in the canvas
- Spill points on flash flood map and depression map
- New surface roughness (Manning) parameters for DynamicFlood
- Workspace and Modelspace sharing updates
- Regionally varying rain in DynamicFlood Sweden
- Veden imeytyminen nyt osana rankkasadeanalyysejä
- Use Scalgo Live anywhere in the world
- DynamicFlood: Live model speed info and regionally-varying rain events
- Sea-level rise: Download building flooding information
- Detailed contour maps and editable buildings in Workspaces
- New in Modelspaces: Explore hydrodynamic simulations and visualise the dynamics of flow velocity
- National German high-resolution land cover map
- Specify basins and protrusions by drawing their outer boundary
- Simplified path features
- National Norwegian high-resolution land cover map
- Organise and communicate on a digital canvas
- New sidebar to help organize your analyses and queries
- Sliding contours
- Ny skyfallsanalys och en ännu bättre marktäckekarta
- New land cover map for Finland
- Depths in the depression map
- New Danish land cover map with more classes
- National Swedish High-Resolution Impervious Surface Mapping
- Watershed tool updated with even better descriptions of catchment characteristics
- National Flash Flood Map with Infiltration and Drainage for Denmark
- Add your own WMS layers to SCALGO Live
- Enriched building data in Denmark
- National hydrological corrections and Land Cover for Poland
- National hydrological corrections for Norway
- Updated Impervious Surface Mapping for Denmark
- National hydrological corrections and updated local data for Finland
- Fast and intuitive tools to work with infiltration and land use
- Improvements to vector imports and exports
- National Danish groundwater model
- New Sweden high-resolution model
- New powerful depression map and more analyses visualization options
- Introducing Modelspaces: Get your hydrodynamic models into SCALGO Live
- Use case videos
- Access a EA flood maps inside SCALGO Live
- Improved map export
- New powerful ways to edit the elevation model
- Better coloring of flooding layers and sea-level depth filtering
- National Danish High-Resolution Impervious Surface Mapping
- National access for local and regional organizations
- Simpler, more powerful downloads
- Customize Layer Transparency
- Hydrological corrections and new data in Sweden
- Improved export functionality
- Access a wide range of authorative data inside SCALGO Live
- Importing VASP data
- Measure gradients, undo edits, and Norway updates
- New terrain edit features, soil balance information and much more...
- Browse historical orthophotos in SCALGO Live
- Emergency planning with sea-level rise from national forecast data
- Detailed information about watershed composition
- Better styling of imported vector layers
- New Danish Elevation Model
- Work with gradients in the profile widget
- Flood risk screening from rivers and flow paths
- New workspace tool: Raise and lower terrain uniformly
- Importing LandXML TINs, LAS point clouds
- New model in Sweden
- Side slopes on workspace features
- Drag and drop enhancements
- Swedish contour maps
- Subsurface basins and sewage drains in workspaces
- New Interface
- Volume information for watersheds and flow paths
- New powerful tool for emergency response and coastal flood prevention
- Denmark: New flash flood map
- Sweden: Geodatasamverkan setting for Swedish users
- Import custom terrain models
- New Hydrological Corrections
- Elevation contours now available
- Download orthophotos as JPEG and PNG
- Subsurface structures in workspace
- Sea-levels in terrain profiles
- Updated orthophotos
- Models and analysis update
- User interface updates
- User interface updates
- GeoDanmark/FOT data, Matrikelkortet now available
- New flash flood map
- Download of risk polygons
- Updated orthophotos
- Nationwide hydrology on the new DHM/2015 model now available
- New flash flood map computation available with watershed download
- DHM/2015 variants and sea-levels now available nationwide
- DHM/2015 now available nationwide
- Hydrology on the new DHM/2015 model now available
- New DHM/2015 Model - now with buildings
- New DHM Model
- Watershed Tool
- Ad hoc layers
- Nationwide contour maps for all countries
- Single Sign-On
- Data Fees
- User Interface
- Canvas
- Analysis
- Workspaces
- Modelspaces
- Working with CAD data
- Core+ DynamicFlood
- Core+ NatureInsight
- Core+ PropertyResilience
- Streams and Flow
- Physical Properties
- Country Specific
-
About
Analysis – Sea-Level Rise
Sea-level Rise enables you to analyze which parts of the terrain that are potentially flooded at a given water level. The flooded areas illustrated on the map are areas below your chosen water level that have a direct connection to the sea via at least one path beneath your chosen water level. Areas that are beneath the water level but protected by an elevated area and thereby separated from the sea are called protected areas. These will not be displayed as flooded unless there is a waterway around the elevated area or a hydrological correction like e.g., a culvert through the elevated area.
The figure below illustrates how the analysis works in SCALGO live.

Regions that are below the new sea-level, but are protected due to hills, levees etc. will not be marked as flooded.
Subsurface structures
Subsurface features are handled in the following way in the sea-level simulation:
Subsurface path: A surface path has two endpoints. The sea-level can flow both way through a path depending on which endpoint of the path the sea reaches first.
Subsurface point: A subsurface point that is not an inlet will never have sea-level flow into, or out of it. This holds regardless of whether the point is standalone or part of a subsurface path, or even a stormwater network. If the point is an inlet, the inlet radius is respected and behaves as explained in the subsurface structure section. The volume property of points are ignored in sea-level analysis.
Stormwater networks: If you have created a stormwater network in your workspace, the sea-level computation will act as if the network is in surface-to-surface mode, regardless of the actual mode of the network. The sea-level analysis does not currently support the surface-to-sink mode. In the surface-to-surface mode, the sea can enter the network at any inlet and will leave the network at any connected inlets with elevation values lower than the sea-level value.
How to use Sea-Level Rise?
When selecting Sea-level Rise, flooded areas are displayed on the map according to the selected water level. It can be selected under Analysis in the Dock.
Slider: Adjusting the sea level
The slider adjusts how much the sea level rises on the map. A water level at 0.0 cm shows the current sea level. When increasing the water level, the flooded areas are displayed in blue. The sea-level analysis also offer a water depth filter in a separate slider. This allows you to filter out shallow depths you do not care about. If the water depth filter is set to 10cm, we do not show any area where the water depth is less than 10cm as flooded on the map.
Point query: View when an area is flooded by the sea
You can assess, for any chosen point, how much the sea level needs to rise before the point gets flooded by the sea. Just choose point query and select any point on the map.
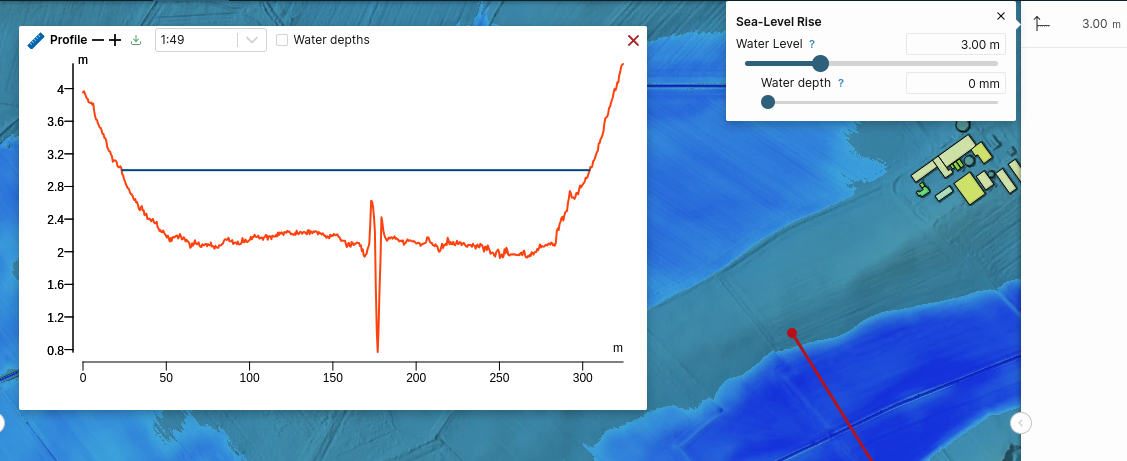
Profile tool: View the water depth in profile
If you want to view the effect of a chosen sea level you can use the profile tool. The terrain profile displays a straight line on the graph. This line illustrates your chosen water level and shows how much of the cross section is flooded.
Styles: The colors
The flooded areas can be illustrated in both blue and purple. Read more about styles in general in the dock.
Download
If you want to download the flooded area, follow the guide under download on the toolbar page. By default, data is downloaded in raster format and includes entails on which sea level leads to flooding at every raster cell. Alternatively, you can download the data as a vector file, which displays the outline of different floods depending on one or several sea levels. The sea levels are chosen in the displayed menu when vector is selected.
Critical Points
Critical points visualizes the points in the terrain where intrusion can occur and lead to significant flooding in low-lying areas behind the critical point. It must be enabled by selecting Critical Points under Sea-Level Rise. Black dots are shown on the map, representing the critical points. The dots on the map is different in size. The smaller critical point, the higher the chosen water level exceeds the elevation of the critical point. When the chosen water level exceeds the critical point with more than one meter, the critical point will no longer be visible on the map.
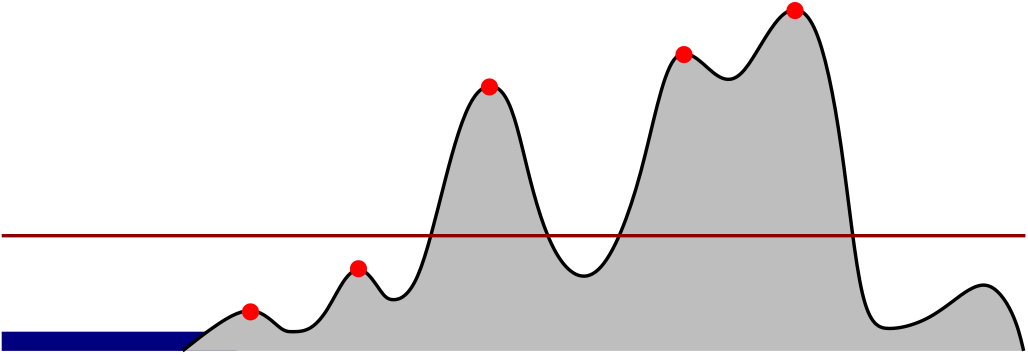
What are critical points
A critical point is a point in the terrain that blocks seawater intrusion. It is called a critical point because it marks where seawater intrusion can occur on the terrain and lead to
significant flooding in low-lying areas behind the critical point. The critical points are visible until they are more than one meter beneath the chosen sea level. If the critical point is surrounded by blue, it is flooded, but by less than a meter. The illustration below shows how critical points works in SCALGO live.
How to use critical points
Slider: Filtering critical points according to the size of the flooded area behind
When Critical Points is chosen in the dock, an additional slider called flooded area emerges. This slider lets you filter critical points according to the protected low-lying area behind the critical point. For example, if you set flooded area a 500 m2, you will only see the critical points where at least 500 m2 is flooded when the water level surpasses the critical point.
- Move the slider to determine the size of the low-lying area behind any critical point.
- Now only relevant critical points are displayed with a point.
The dots on the map are different in size. The smaller critical points are flooded points where the water level is less than one meter above the critical point. The smaller the critical point, the closer the water level is to one meter above the point. When the water level is more than one meter above the point, it will no longer be visible on the map, as it is no longer regarded as critical.

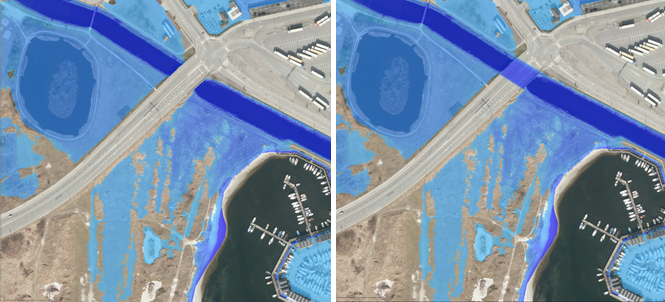
How critical points appears on the map: the dot is not displayed in the first picture, as the water level is not high enough to make the area susceptible to flooding. When changing the water level to 1.93 m. in picture two, the area becomes susceptible and the dot appears. The dot becomes smaller on picture three as the water level exceeds the critical point.

How critical points appears on the map: the dot is not displayed in the first picture, as the water level is not high enough to make the area susceptible to flooding. When changing the water level to 1.93 m. in picture two, the area becomes susceptible and the dot appears. The dot becomes smaller on picture three as the water level exceeds the critical point.

How critical points appears on the map: the dot is not displayed in the first picture, as the water level is not high enough to make the area susceptible to flooding. When changing the water level to 1.93 m. in picture two, the area becomes susceptible and the dot appears. The dot becomes smaller on picture three as the water level exceeds the critical point.
Point query: Get information about a critical point
The point query tool provides information about:
- The size of the area behind the critical point which is flooded
- The volume of water in the flooded area at the time when it first floods
- The sea level necessary to flood the critical point
Download: Get data on the critical points
Critical point can be downloaded as a vector file showing a point for each critical point and information about the elevation, where the point is flooded as well as the area and volume of the flooded area behind the critical point. If you want to know how to download, please read the download section under toolbar.
Show Subsurface
By default, we do not include subsurface structures in the analyses. Subsurface structures (e.g. underpasses and culverts) can be created in a workspace. In some countries, they are also included in the national analysis through a national set of hydrological corrections. If this is the case, SCALGO Live has a Show subsurface option in the dock.
NOTE: relevant subsurface structures are always included in the computation. The option in this analysis only affects how the output is rendered, not whether the subsurface structures have an effect or not