About – What's New
Simplified tools for designing with contour lines
Today we are releasing an update that simplifies our contour tools for editing the terrain in workspaces. Our open contours - contours that are not closed rings - are now more powerful and affect a larger part of the surrounding terrain. It is no longer necessary to take great care that the open contour lines start and end on a special boundary curve - just draw your design, and Scalgo Live takes care of the rest! This means that it is easier to sculpt the terrain, and even designing sloped terrains, using the open contour tools. This is particularly useful for easily bringing a landscape design from CAD software into Scalgo Live.
The accompanying blog post has some nice visual examples of what you can do with the updated contour tools.

A design created using the new contour tools
As part of this change we have removed the "dividing contour tool". Contour groups created with dividing contours will still work as expected, but no new ones can be created.
DynamicFlood: Organize and understand your computations
Today we have updated Core+ DynamicFlood to make it easier to organize and understand your computations. You can go back and see detailed information about how your computations were set up, both while they are running and after they have completed. We have also added more flexible options for naming computations, and for understanding the performance of the models. For more information, read on below:
Before and during computation
When starting a DynamicFlood computation, you now have the option of changing the title and description of the modelspace that will store the result of the computation. The title and description can also be changed while the model is running by expanding the DynamicFlood progress bar in the right sidebar, where you can now also access information about the physical parameters (rain event, infiltration, surface roughness) being used.
When the computation has finished
Click the information button, next to the event in the modelspace, to show the selected event's physical parameters. Here you can also enable the new model speed layer, and access information on the computation's runtime, timestep, control numbers and more.
With the model speed layer, you can explore the layer's green, yellow and red areas to understand where the model had to use a small timestep. Adjust the slider, which is in units of seconds, to view just the areas where the timestep is below a certain threshold. For more information, we refer to the DynamicFlood documentation. The model speed layer is available for DynamicFlood computations created after the 26th of September 2025.

You can set the title and description while the dynamic model is running, and when it is finished, you can enable the Model Speed layer to see where the model is slow.
Modelling stormwater networks in Scalgo Live
Stormwater systems are complex by nature, spanning everything from streams, swales and ponds on the surface to large underground drainage networks. With the latest developments in Scalgo Live, these worlds can now be explored together. Our latest release expands our tooling around subsurface structures with the ability to connect subsurface paths and thereby create larger systems of subsurface structures and stormwater networks.
For more information, please see the accompanying blog post and our new getting started video on the subject. There is also an upcoming webinar that will dive deeper into the motivation, design and use cases around this new feature.
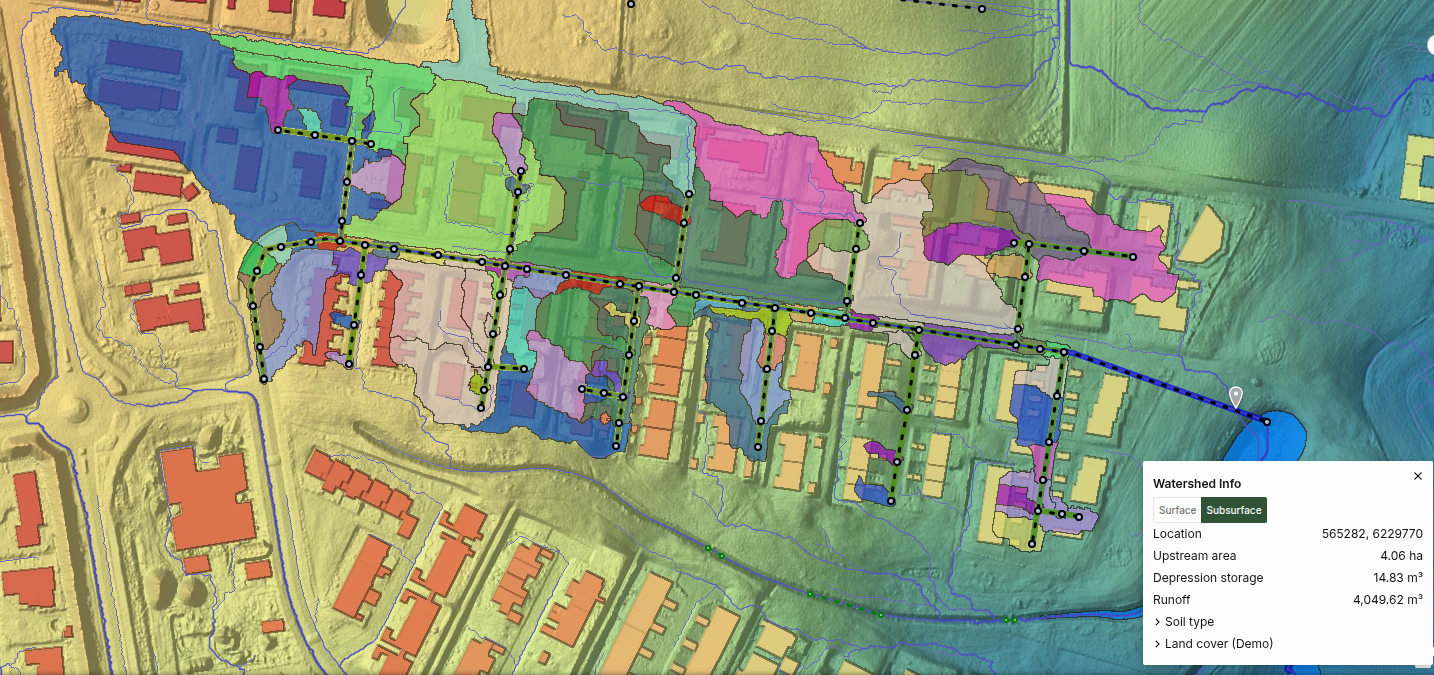
Here we have modeled a stormwater network for a small neighborhood. We have then computed the Flash Flood Map and used a watershed query on the network. The query reveals the subwatershed of all the individual sinks in the network. This information is readily available for download for use in other tools.
In addition to the ability to create stormwater networks, the release has the following implications for existing features in Scalgo Live:
- To simplify the user interface, we have removed the standalone "subsurface volume" tool. Instead, this functionality is now available through the "point" option in the consolidated subsurface tool.
- To make it easier to capture relevant flow paths into subsurface structures, we have introduced the notion of an inlet radius that allows a subsurface path to collect water from an area adjacent to the inlet itself. This feature is not only available on stormwater networks, but can also be used on traditional subsurface paths.
If you want to start using the new feature right away, we suggest you dive in to the documentation section for subsurface structures and the section for stormwater networks.
National US high-resolution land cover map
We are happy to announce the immediate availability of a nationwide high-resolution land cover map for Scalgo Live in the United States. The map is produced by Scalgo and based on advanced machine learning techniques. It has a high resolution of 25 cm.
It is available as a standalone layer in the Land cover category in the library.

The Scalgo Land Cover map distinguishes between 12 classes at 25 cm resolution.
The map is fully integrated into Scalgo Live and is, for instance, used to show aggregate land cover information for watershed queries as well as aggregated land cover information for certain administrative areas. For more information please see the complete release announcement.
New functionality for CAD users!
We’ve made it easier than ever to get started on detailed design in CAD. With our new 3D site model export feature, we combine elevation and land cover data into a single 3D site model prepared for your favourite CAD tool. Simply select the export tool, draw a polygon around your site and export your CAD-prepared site model.

A 3d site model exported from Scalgo Live and rendered in Revit.
Your site model is created directly from the nationwide data that you already know from Scalgo Live - data from trusted government agencies. It is also possible to create your site model from a workspace so you can start working on your surface water planning in Scalgo Live and then export a site model for more detailed design.
Read more about the product on our website. Watch the short getting started videos about the export tool in general and the workflow for importing into Revit. See the manual for more details on both exporting and importing CAD site models.
DynamicFlood: Cleaning up rain events and adding historical rains, now available in France
Today we are releasing a number of updates to Core+ DynamicFlood:
- DynamicFlood is now available in France!
- The national rains in Denmark changed to vary by region.
- We have restructured the display of national rains, making it easier to select the events you care about.
- You can now easily adjust climate factors and other rain parameters.
- We have added historic rain events to some countries, and we're working on adding them in more countries.
- For the technically inclined: We have switched to a new way of discretizing CDS rains; see the changelog for more information.
Below we dive deeper into some of these:
DynamicFlood in France
Combining our French land cover map with our Topsoil map (using data from soilgrids.org) and lots of rain data, we have set up Core+ DynamicFlood for France. We are excited to bring the power and simplicity to yet another Scalgo Live Country.
Regional national rains in Denmark
Using data from Spildevandskomiteen, we have released regional rain events in Denmark. This means that when you create future DynamicFlood computations, the rain event will be specific to the location of the workspace. For more information, please consult the documentation.
Historic rains
It is often relevant to run on on interesting historic events, instead of design storms. To facilitate this, we have begun adding famous historical events to the countries where DynamicFlood is available, starting with Denmark, Sweden and France. The rains can be inspected from the "run hydrodynamic engine" dialog in those countries.
Reorganization of rain dialog
We have reorganized the rains in DynamicFlood, making them easier for you to find, and to make room for the historic rains. We have done this by grouping relevant rain events together so you can quickly get an overview of the available scenarios and select the return periods you are interested in.

The rain setup in Germany where the rains are grouped into "Future climate" and "Present climate" categories.
New options to configure the rain events
At the same time we are introducing some powerful new way to configure rain events and adjust various settings. For instance, it is now easy to change the climate factor for an individual return period, or a whole set of return periods at the same time.

Editing a set of rain events now allows you to change the climate factor. In countries where the rain is based on Chicago Design Storms, you can set CDS parameters, including the symmetry coefficient and the duration.
Remember: you can always get more information about the rains used in your country through the rain documentation and the relevant country-specific manual page.
National Polish high-resolution land cover map
We are excited to announce the immediate availability of a nationwide high-resolution land cover map for Scalgo Live in Polish. The map, produced by Scalgo, is based on advanced machine learning techniques and has a high resolution of 25 cm.
It is available as a standalone layer in the Land cover category in the library.

A section of the Polish land cover map.
The map is fully integrated into Scalgo Live Poland and is, for instance, used to show aggregate land cover information for watershed queries as well as aggregated land cover information for certain administrative areas. For more information please see the complete release announcement (in Polish).
DynamicFlood now available in Great Britain
DynamicFlood is now available in Great Britain!
We have combined the industry-leading TUFLOW engine with data and interactive visualisations in Scalgo Live to create a user-friendly and efficient 2D flood model. Now DynamicFlood is available everywhere in Great Britain - it's the easiest way to run flood simulations!
If you are interested in knowing more, you are very welcome to join the free webinar on September 24th to see first hand how you can use DynamicFlood in your projects. You can also read more on the DynamicFlood website, or you can contact us to book a demonstration.
Global contour maps now available
Scalgo Live Global was recently updated with the Copernicus GLO-30 Digital Elevation Model (DEM), offering global 30-meter resolution elevation data.
We have now added contour lines, making contour display available everywhere on Earth, at contour intervals between 10 m and 500 m. As with all our contour maps, you can toggle the display of peak and sink markers, to allow you to easily identify those.

50 m contours, with peak markers, for an area around Rio de Janeiro, Brazil.
Using our point query tool, individual contours can be highlighted and followed. This works even across entire continents - try for instance the 1000 m contour line that encloses the Himalayas. You can also discover the 500 m contour around the Alps, was your intuition regarding its reach correct?
Updated Swedish topsoil map
Aligned with our regular update schedule, we have just updated our Sweden computation with new data, including fresh elevation and land cover data. As part of this update we have made changes in the way we map the soiltypes from the SGU Jordarter to our own topsoil classes. These topsoil classes are used in the Flash Flood Map with infiltration and runoff, and in Core+ DynamicFlood.
In particular, a number of SGU classes are now mapped to slightly more conservative topsoil types, resulting in less infiltration than previously. For instance, a prominent example is morän, which previously mapped to fine sand, but is now mapped to coarse clay with sand. We also found some implementation issues in our previous mapping which resulted in some soil types not being mapped according to the specification, this has now been corrected. The change will impact all new workspaces created after the update, existing workspaces are not affected.
Remember, you can always see what topsoil classes are used in new workspaces, and nationally, by enabling the "Topsoil" layer inside Scalgo Live. You can also change infiltration parameters both for DynamicFlood and for the Flash Flood Map if you want to use a different setup than the default.
The complete mapping from SGU Jordarter to our topsoil classes is available in the Sweden documentation.
Updates to Horton parameters in Core+ DynamicFlood
In tandem with this release, we are also updating some Horton infiltration parameters in DynamicFlood, for all countries. In particular, low compaction sandy soils, gravel and rocks and boulders have been updated to better align with other guidelines. This update is not expected to cause significant changes to simulation results. The new parameters will be applied to all new workspaces created after the update. This change has been recorded in the DynamicFlood changelog.

The updated Swedish topsoil map.