About – What's New
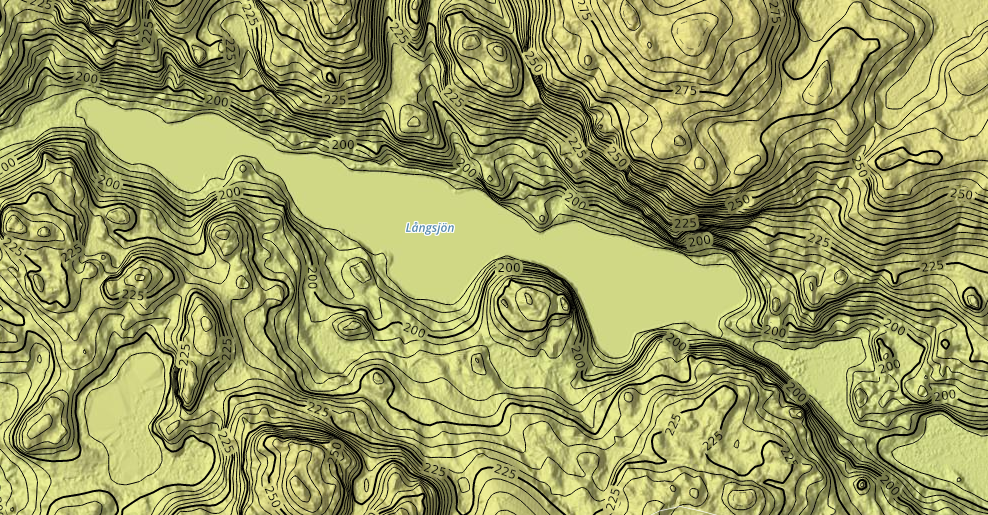
Swedish contour maps
We are proud to announce the release of a nationwide Swedish contour map based on the full high-resolution (2m) national elevation model. It is available for immediate viewing and download in SCALGO Live.
The contour map comes in different equidistances and is designed to be cartographically pleasing and have a manageable size, and at the same time provide hard guarantees on how much each individual contours deviates from the elevation model in the x, y and z axis. The map has been generated based on the SCALGO technology that was used to generate the national Danish contour map.
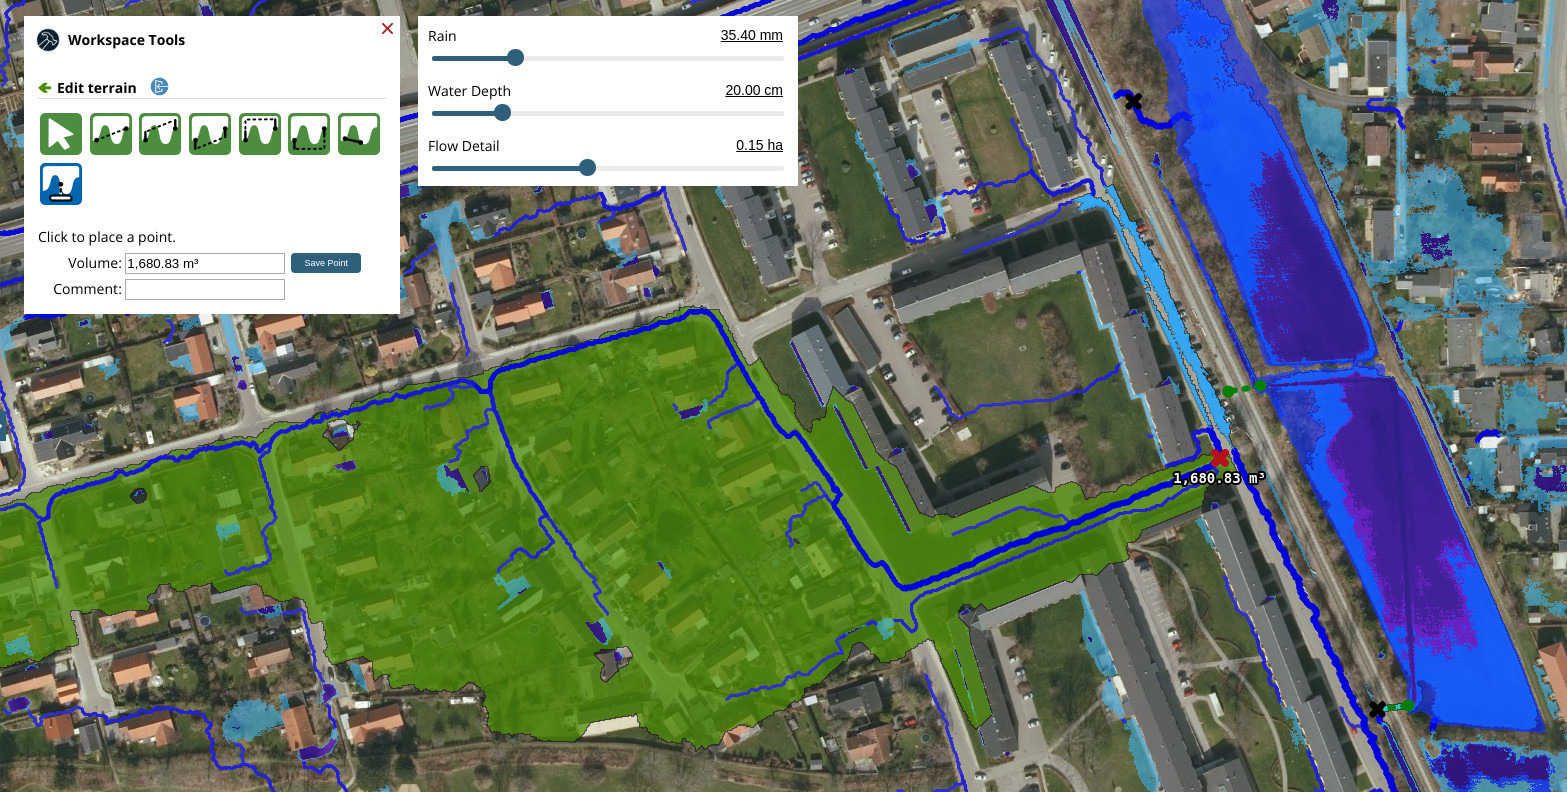
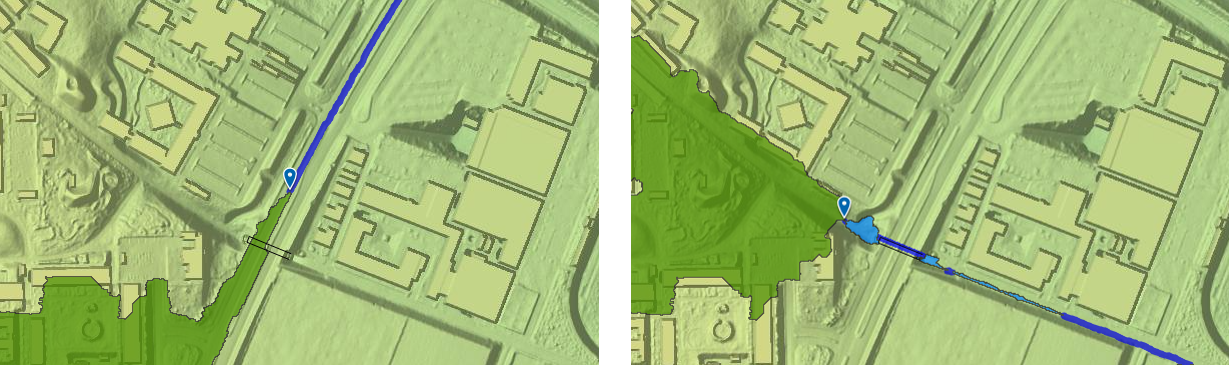
Subsurface basins and sewage drains in workspaces
We have added a new workspace tool that lets you model a subsurface basin or sewage drain in a point. The point is modelled as a sink of a user-specified finite volume, any flow entering the sink will stay in the sink until the full volume (service level) associated with the sink has been consumed. This volume can either be typed in manually or set to an event-specific runoff volume. The latter is done using the watershed of the sink point to define the area and the flash flood map rain slider to define the event. See the manual for more information about how to use the new tool.
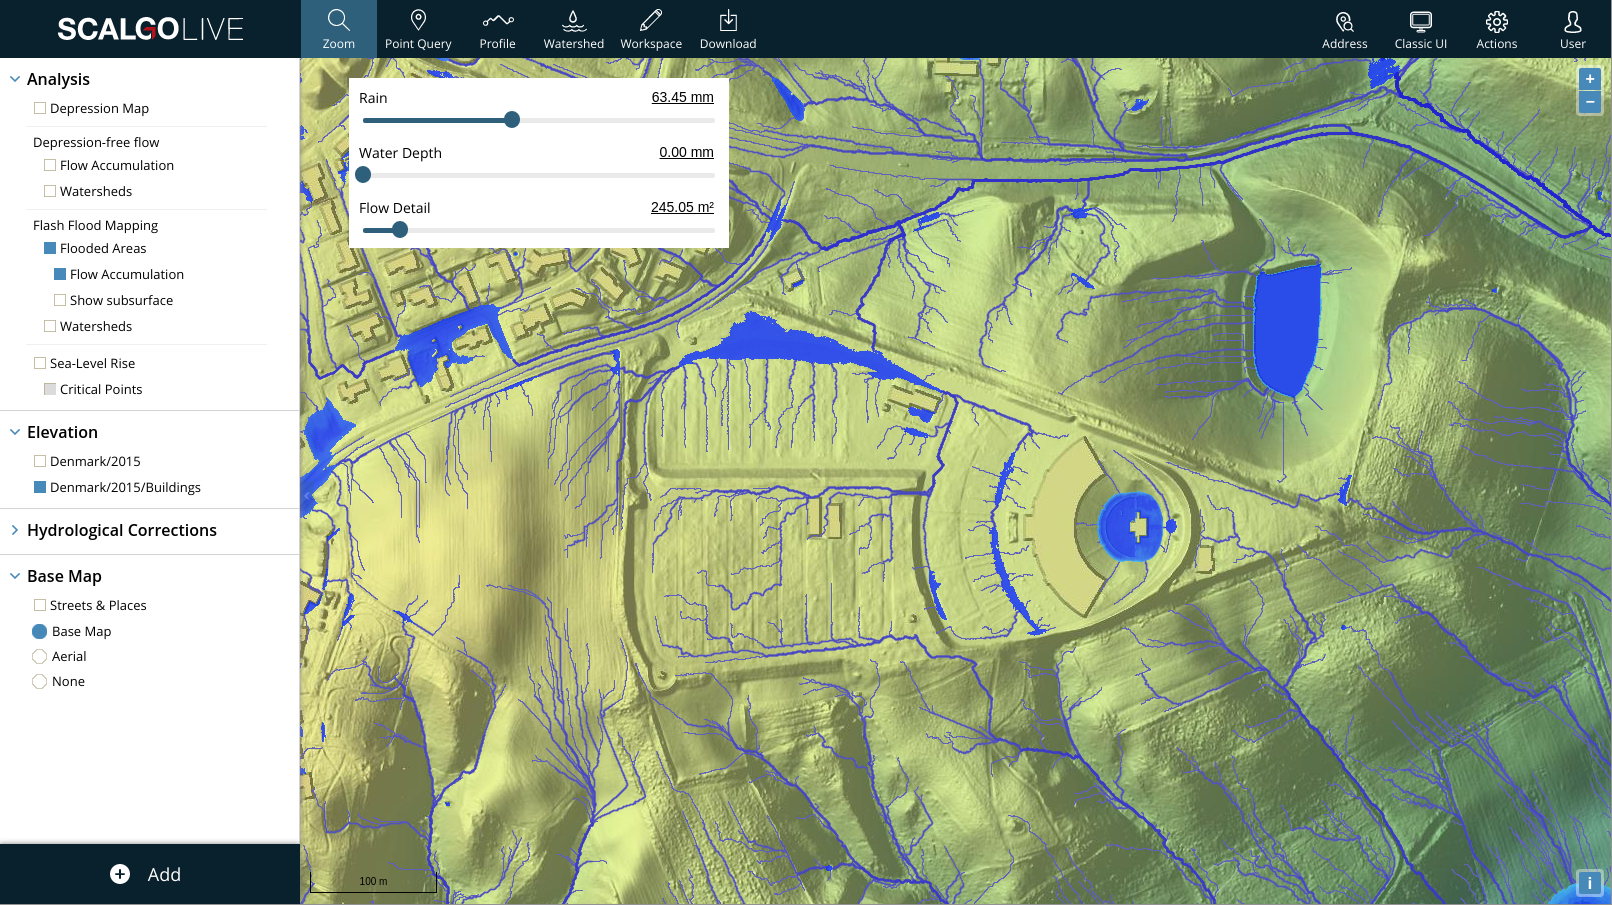
New Interface
We have redesigned the user interface to simplify access to the information you care about, allowing you to focus on your task and limit the time spend searching for a particular dataset. You can read more about the new interface in the corresponding news story.
Export high-resolution maps
As part of the release it is now possible to export the current map view as high resolution JPEG and PDF files. Look for the tool in the Actions menu in the top right corner.
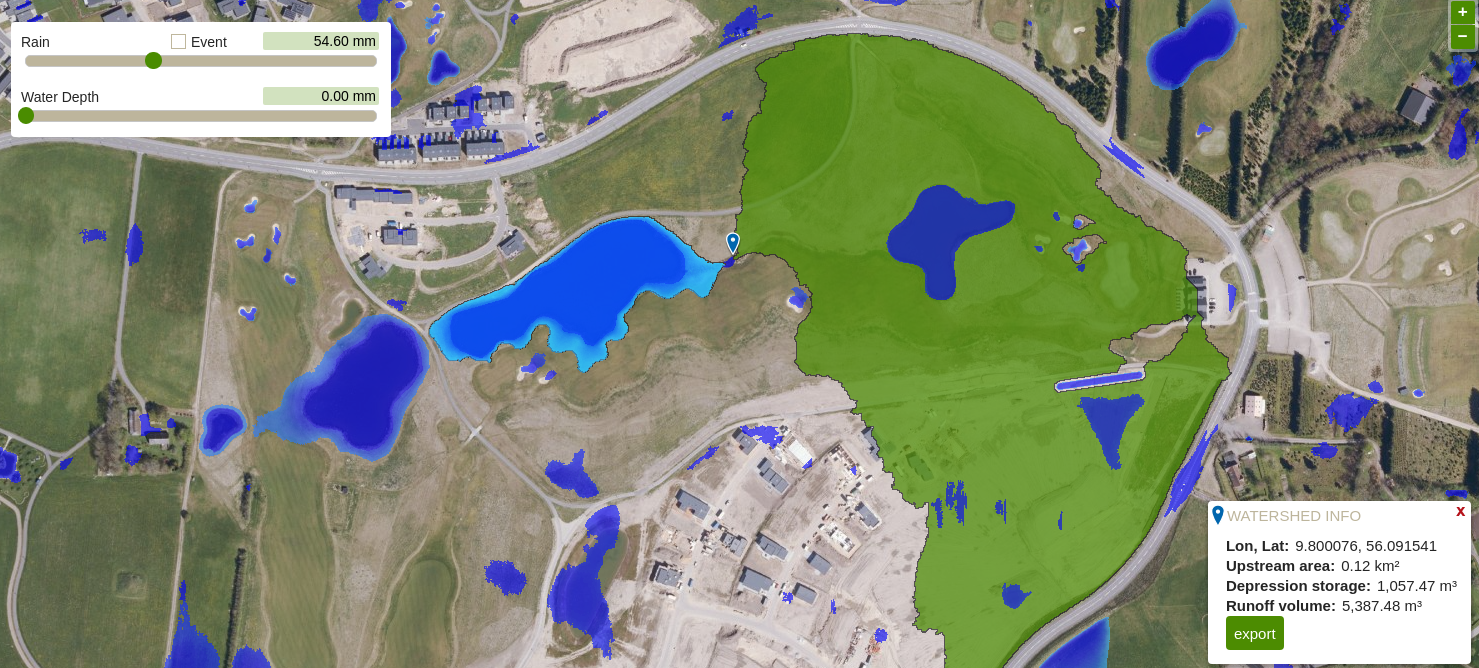
Volume information for watersheds and flow paths
When using the flash flood map watershed tool you now get information about the volume of water flowing through the queried point, and the volume of water stored in depressions upstream. More precisely, you get the depression storage of the point, which is defined as the volume of rainwater stored in the depressions in the watershed of the point. You also get the runoff volume flowing through the point, this is the total volume of the precipitation upstream of the queried point minus what is stored in depressions in the watershed. We refer to the manual for more information.
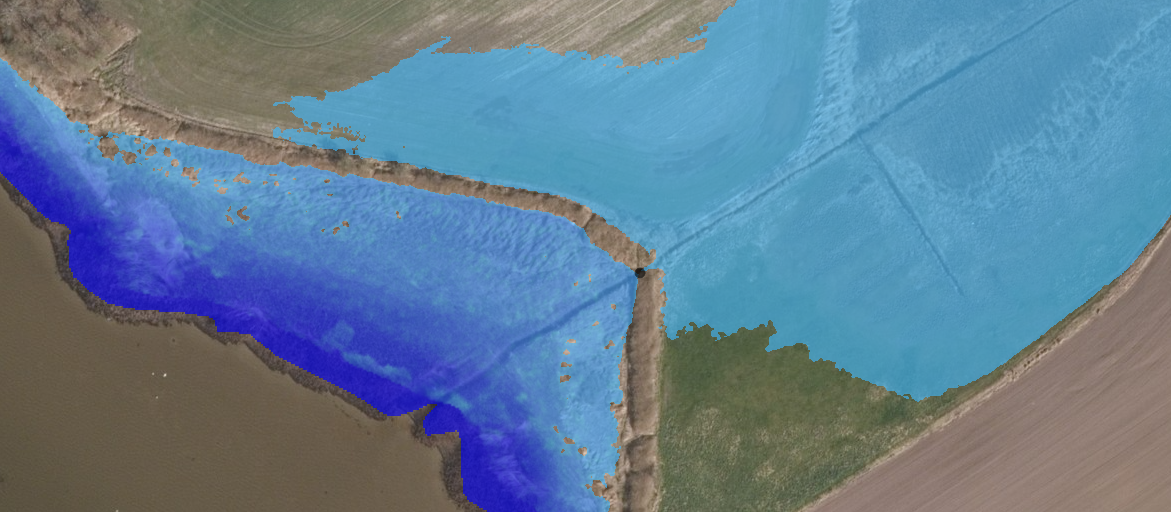
New powerful tool for emergency response and coastal flood prevention
SCALGO Live has proven a valuable tool for emergency responses under multiple different flood events in Denmark in 2017. With this release, we enhance your ability to visualize, prioritize, and plan coastal protection. Using the new "Critical Points" analysis (available with "Sea-Level Rise" layers), users can visualize the vulnerable points where seawater can intrude and flood low-lying areas beyond. The critical points might be dimples in dykes, or a natural water path, e.g. a small stream of particular interest for flood prevention.
The feature is also available in workspaces, where users can test the effect of barriers at the critical points and generate new vulnerability maps of the critical points that may emerge after placement of these barriers.
Critical points are ranked by the size of the area at risk, that is, the area that is flooded if the seawater rises above the critical point. Using a slider, points associated with a low area at risk can be filtered out.
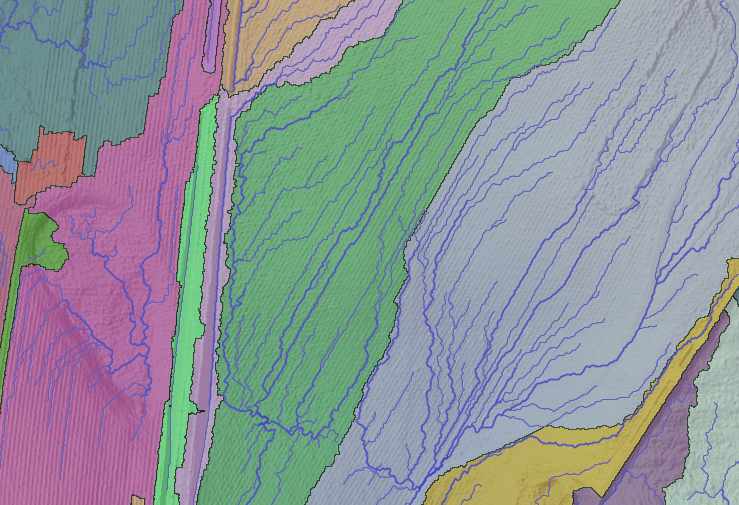
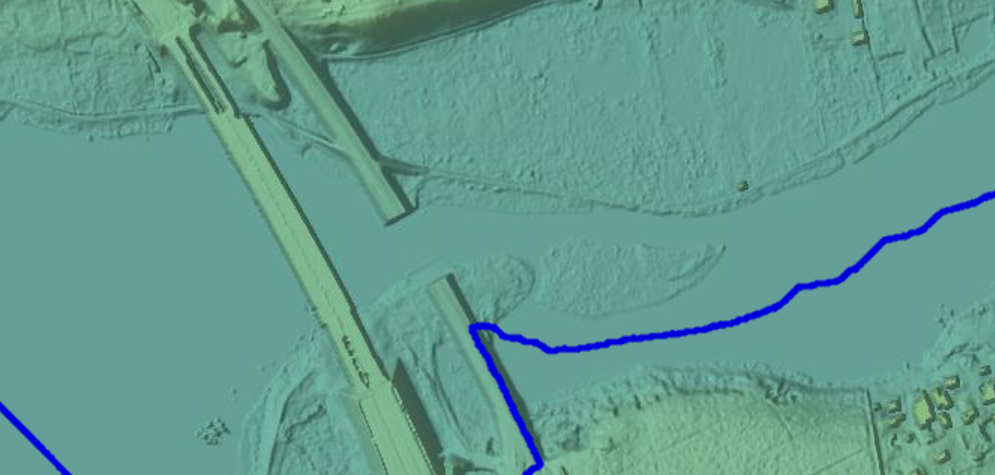
Download watersheds as vectors
By popular request, you can now download vectorized watersheds in SCALGO Live. When you select the download button next to a watershed layer, the UI will ask you if you want a vectorized output or the raw watershed raster. Note that the vector output is not simplified so the polygons can be fairly large.
Denmark: Models and analysis update
We have updated the elevation models and the analysis products (flash flood map, flow accumulation, watersheds and sea-level rise) to include newer buildings from GeoDanmark - acquired on November 19 2017 from Kortforsyningen. Your existing workspaces have not been changed.
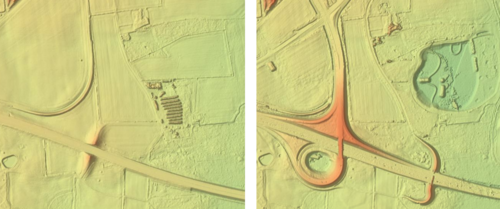
Denmark: New flash flood map
We have updated the flash flood map in SCALGO Live Denmark. Traditionally, the national Danish set of hydrological corrections to the terrain model are used to hydrologically condition the terrain model by carving through barriers (e.g. bridges) in the terrain model. However in the new flash flood map, we use the hydrological corrections as subsurface structures instead. This implies that we can distinguish the flow across a bridge from the flow underneath it. Note that in SCALGO Live, a subsurface structure transports an unlimited amount of water, but it does not store any water itself – it has zero volume.
Furthermore, when you create a workspace, hydrological corrections are
now imported into the workspace as editable features. This implies that
you can now work directly with the hydrological corrections inside a
workspace. It is still possible to create a new workspace based on the
traditional terrain model with the corrections included.
Denmark: New base map
We have switched the view projection for SCALGO Live Denmark to UTM32. This implies that we can now use the standard base maps put out by the Danish Agency for Data Supply and Efficiency (SDFE). This should also make it easier to integrate SCALGO Live with certain webgis and will improve the precision of elevation profiles.
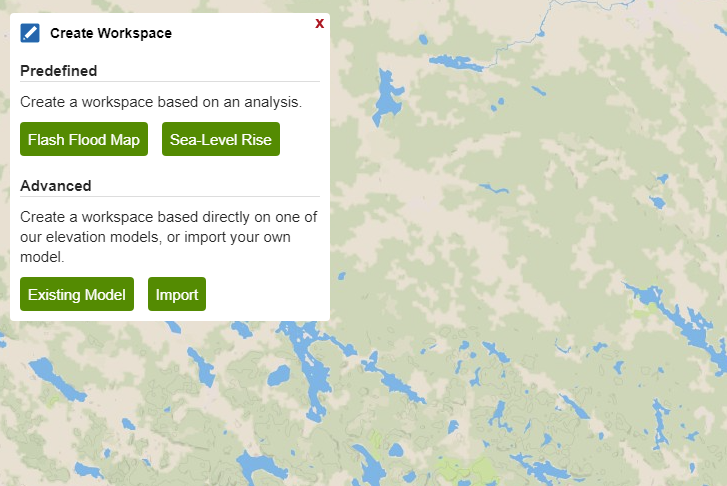
New workspace creation dialog
We have updated the workspace creation dialog. It now provides a convenient shortcut for users wishing to create a workspace for working with the flash flood map or the sea-level analysis. Using the analysis-specific creation option you no longer have to manually select an elevation model. For instance, when you want to work with the flash flood map the system will pick the model matching the national analysis available and configure the workspace computation options so that only the flash flood map is computed. The dialog also makes it easy to manually select a model in the traditional way, or to upload your own model.
Workspace duplication
You can now duplicate a workspace. Simply find the detailed workspace view in the account management system and hit the duplicate button underneath the map.
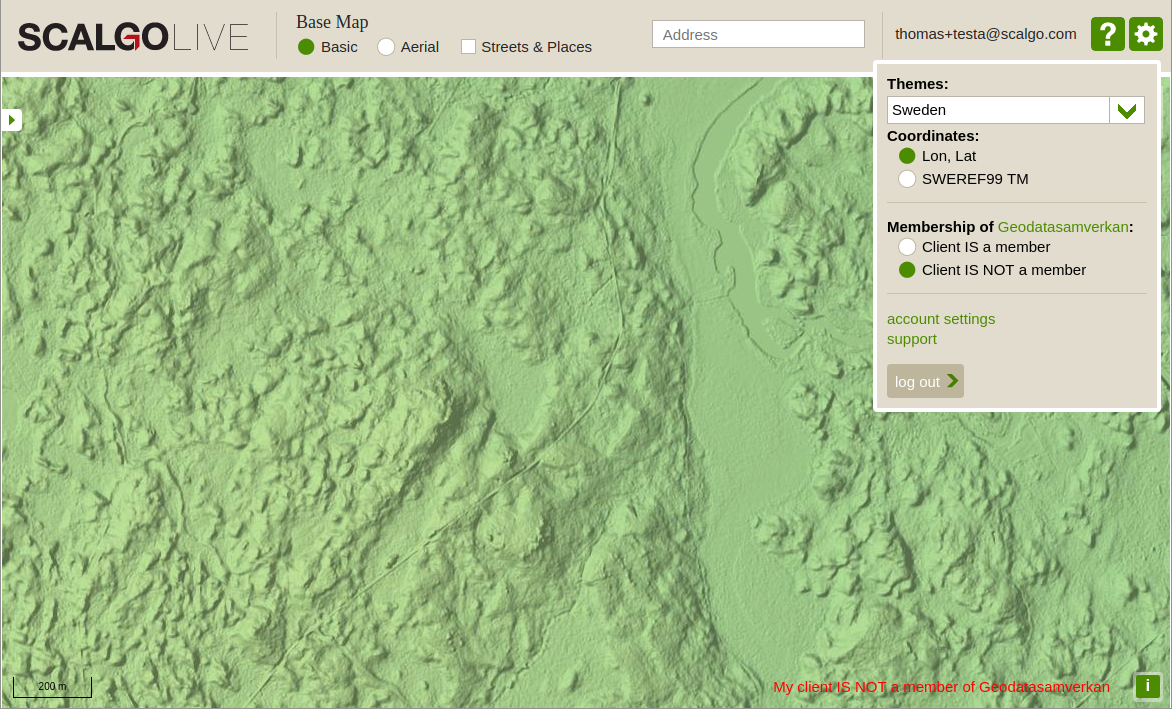
Sweden: Geodatasamverkan setting for Swedish users
Consultants using SCALGO Live Sweden now have the option to specify if their client is a member of Geodatasamverkan or not. When a user tells SCALGO Live that their client is a member of Geodatasamverkan no costs are incurred for the data accessed while this setting is enabled. It is the responsibility of the user to set this switch correctly as we are unable to retroactively change this setting one way or the other. This setting is global to your user account, so if you have multiple SCALGO Live instances running, the change will apply to all of those.
To ensure that it is clear what setting is used, the status will show at the bottom right of your map view at all times. It can be changed by accessing the option in the gear menu in the upper right corner of the screen.
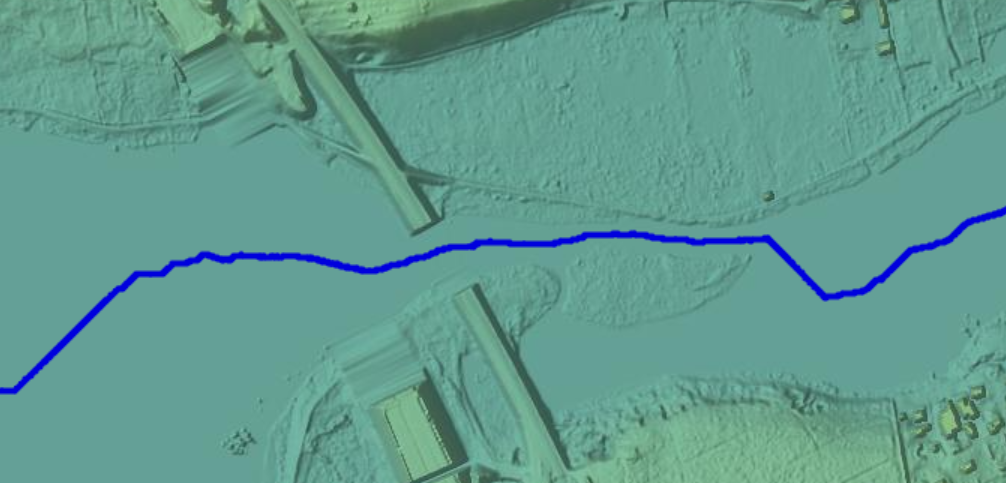
Visibility improvements to flow lines
By popular request we have made flow lines in SCALGO Live easier to see on the map.
Import custom terrain models
It is now possible to import your own raster models into SCALGO Live. The model will be available in a workspace where all the usual workspace tools and analysis options will be available. You can also choose to combine the imported model with the national model in a workspace to e.g. include the entire watershed of your imported model in that workspace.
For more information about using the raster upload feature, please consult the manual.
New Hydrological Corrections
Today SDFE released updated hydrological corrections for the Danish elevation model from 2015, known as Denmark/2015 in SCALGO Live. These corrections, collected in 2016, significantly improve flow routing in many places and affect many of our analysis products (including the flash flood map, flow accumulation, watersheds and sea-level rise). We have updated our analysis products on the 2015 model to use the new corrections.
Workspaces
Your existing workspaces have not been updated, if you wish to update your workspace to use the new elevation model you can export all your workspace edits through your account page and then import those edits into a newly created workspace.
Elevation contours now available
We are proud to announce the release of three new elevation contour data sets in SCALGO Live, all based on the 0.4m national elevation model. They are available for immediate viewing and download in SCALGO Live.
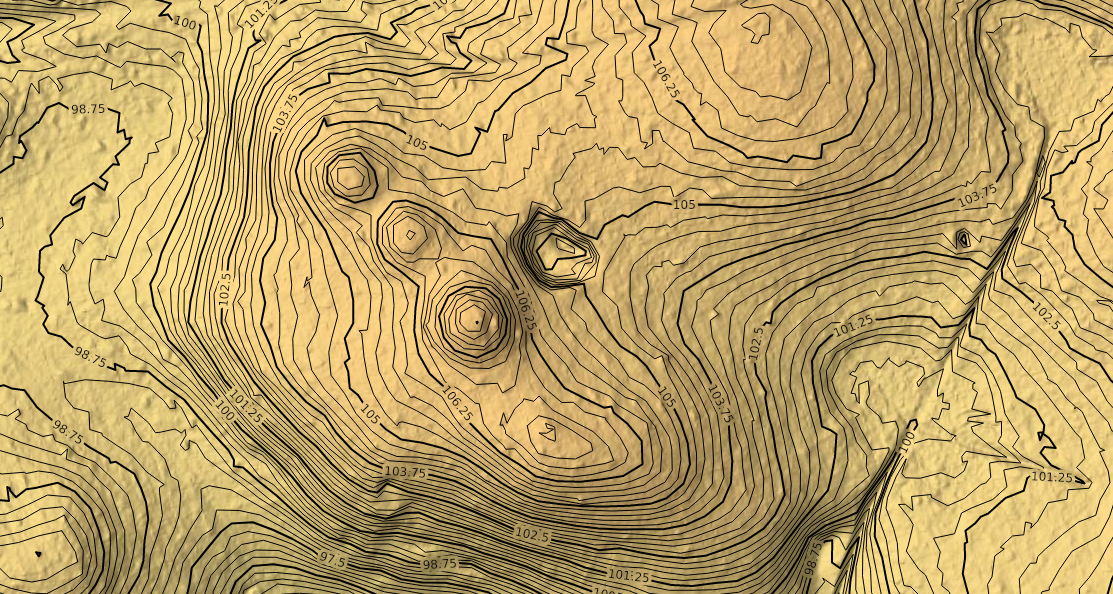
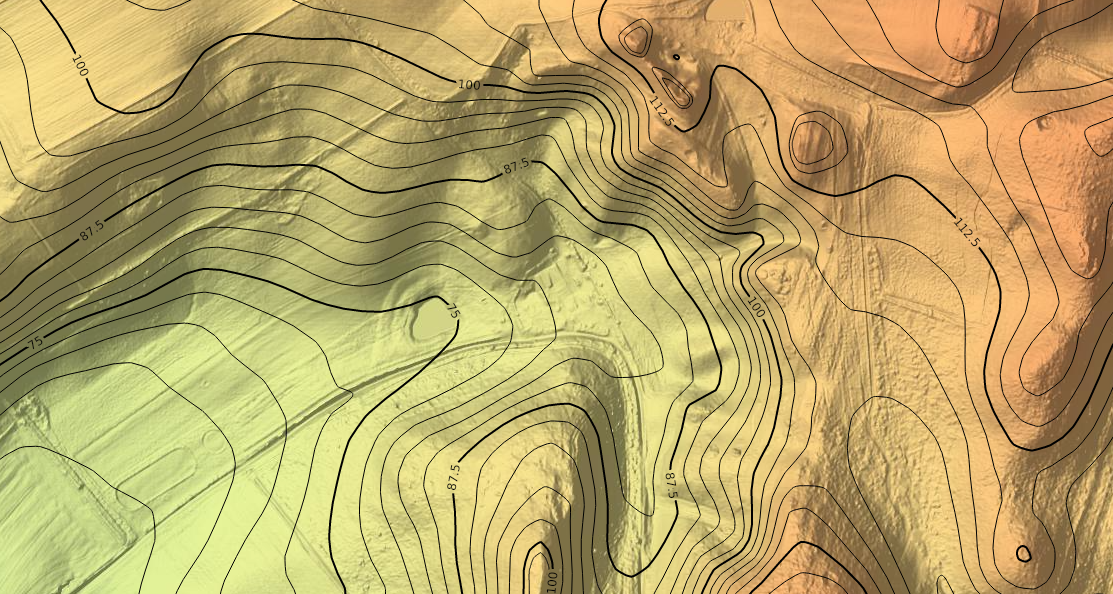
Contour map
The contour map is used to depict the main features of the elevation model with pretty and smooth contours. It is available with an equidistance of both 0,5 meter and 2,5 meter. The elevation of a contour is guaranteed to not deviate more than half the equidistance from the underlying point in the model.
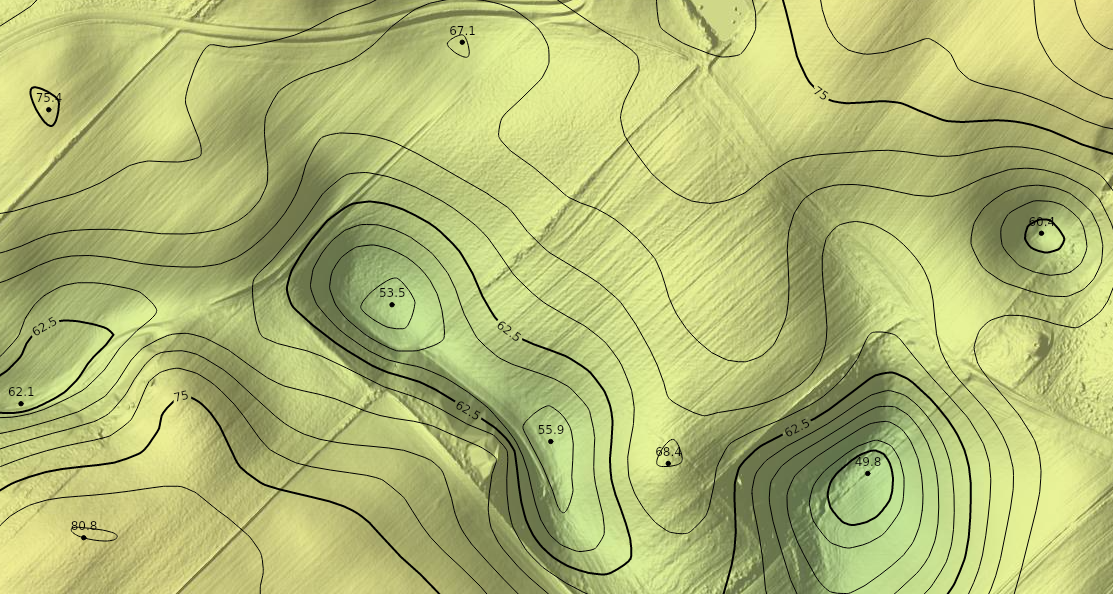
Extremal points
The contour map is enriched by a set of extremal points. Those are points that are at the top of a hill or at the bottom of a depression. Each such point is annotated with the elevation value at that point.
Reference contour map
The reference contour map very accurately conveys the information of the underlying elevation model. It has an equidistance of only 25 centimeters. The deviation on reference contours in relation to DHM is not only restrained to half the equidistance (as with the contour map), but also restricted to 80 centimeters in the plane i.e. the elevation on a reference contour can be found within 80 centimeters in the model.