About – What's New
National Norwegian high-resolution land cover map
Today we announce the availability of a nationwide high-resolution land cover map for SCALGO Live in Norway. The map, produced by SCALGO, is based on machine learning techniques and has a resolution of 25 cm.
It is available as a standalone layer in the Land cover category in the library.
The map is fully integrated into SCALGO Live Norway and is, for instance, used to show aggregate land cover information for watershed queries. For more information please see the complete release announcement.
Organise and communicate on a digital canvas
Say hello to Canvas, a brand-new extension of SCALGO Live released today.
Use Canvas to organise and communicate your work by drawing shapes and placing comments directly on top of existing maps, analyses, and workspaces. Easily combine data from various sources by uploading your own vectors or extract results from SCALGO Live directly to your Canvas.
Canvas is the easiest way to start creating your plans and projects. Work together with your team, clients or stakeholders to conceptualize ideas and solutions. Store meeting notes directly on top of maps and analyses, and share entire project documentations in Canvas with the team.
Check out the Canvas page for more inspiration on how to use the new tools in your work. We can't wait to see all the cool things that you will do with Canvas.
Watch the Getting started-video for an introduction to Canvas
Join webinar on the 8th of November at 10:00 (CET)
Join the webinar for an introduction to Canvas and a guide on how to use the new tools. See a few illustrative use-cases for inspiration on how to start using Canvas in your work.
New sidebar to help organize your analyses and queries
From now on, all sliders, info boxes and computation tasks will appear in the new sidebar. The sidebar can be collapsed to enlarge the map, or expanded to get an overview of sliders and query results.
Test it out:
- Turn on one of the analyses in the left menu
- Use one on the query tools in the top bar
Check out the video below for a quick introduction to the new sidebar.
You can read more about the sidebar in the documentation.
Sliding contours
Not so long ago we released beautiful and detailed nationwide contour maps with intervals of 50 cm and 2.5 m. Now we introduce a whole new contour map that allows you to select the contour interval that suits your purpose and scale. This powerful tool will make it easier to adjust the view to your desired level of detail.
For more information, please see the accompanying blog post.

The contour slider set to show contours at a 2.5m interval.
Ny skyfallsanalys och en ännu bättre marktäckekarta
Spännande nytt i SCALGO Live! 🤩 Vi har utvecklat en helt ny skyfallskarta som tar hänsyn til infiltration för olika jordarter samt avdrag för ledningsnät. Dessutom har vi lanserat en ny högupplöst marktäckekarta med ännu fler klasser.
Se en kort introduktion
Webinar om den nya releasen
Den 20 juni, kl 14 genomgick Hampus Åkerblom, marknadschef i Sverige, hur den nya skyfallsanalysen och marktäckekartan är utvecklad och hur du kan arbeta med dessa i SCALGO Live.
Läs mera om denna lansering i bloggen
Blogginlägg om marktäckekartan: Ny marktäckekarta med ännu flera klasser
Blogginlägg om skyfallsanalysen: Skyfallskarta med infiltration och avdrag för ledningsnät
New land cover map for Finland
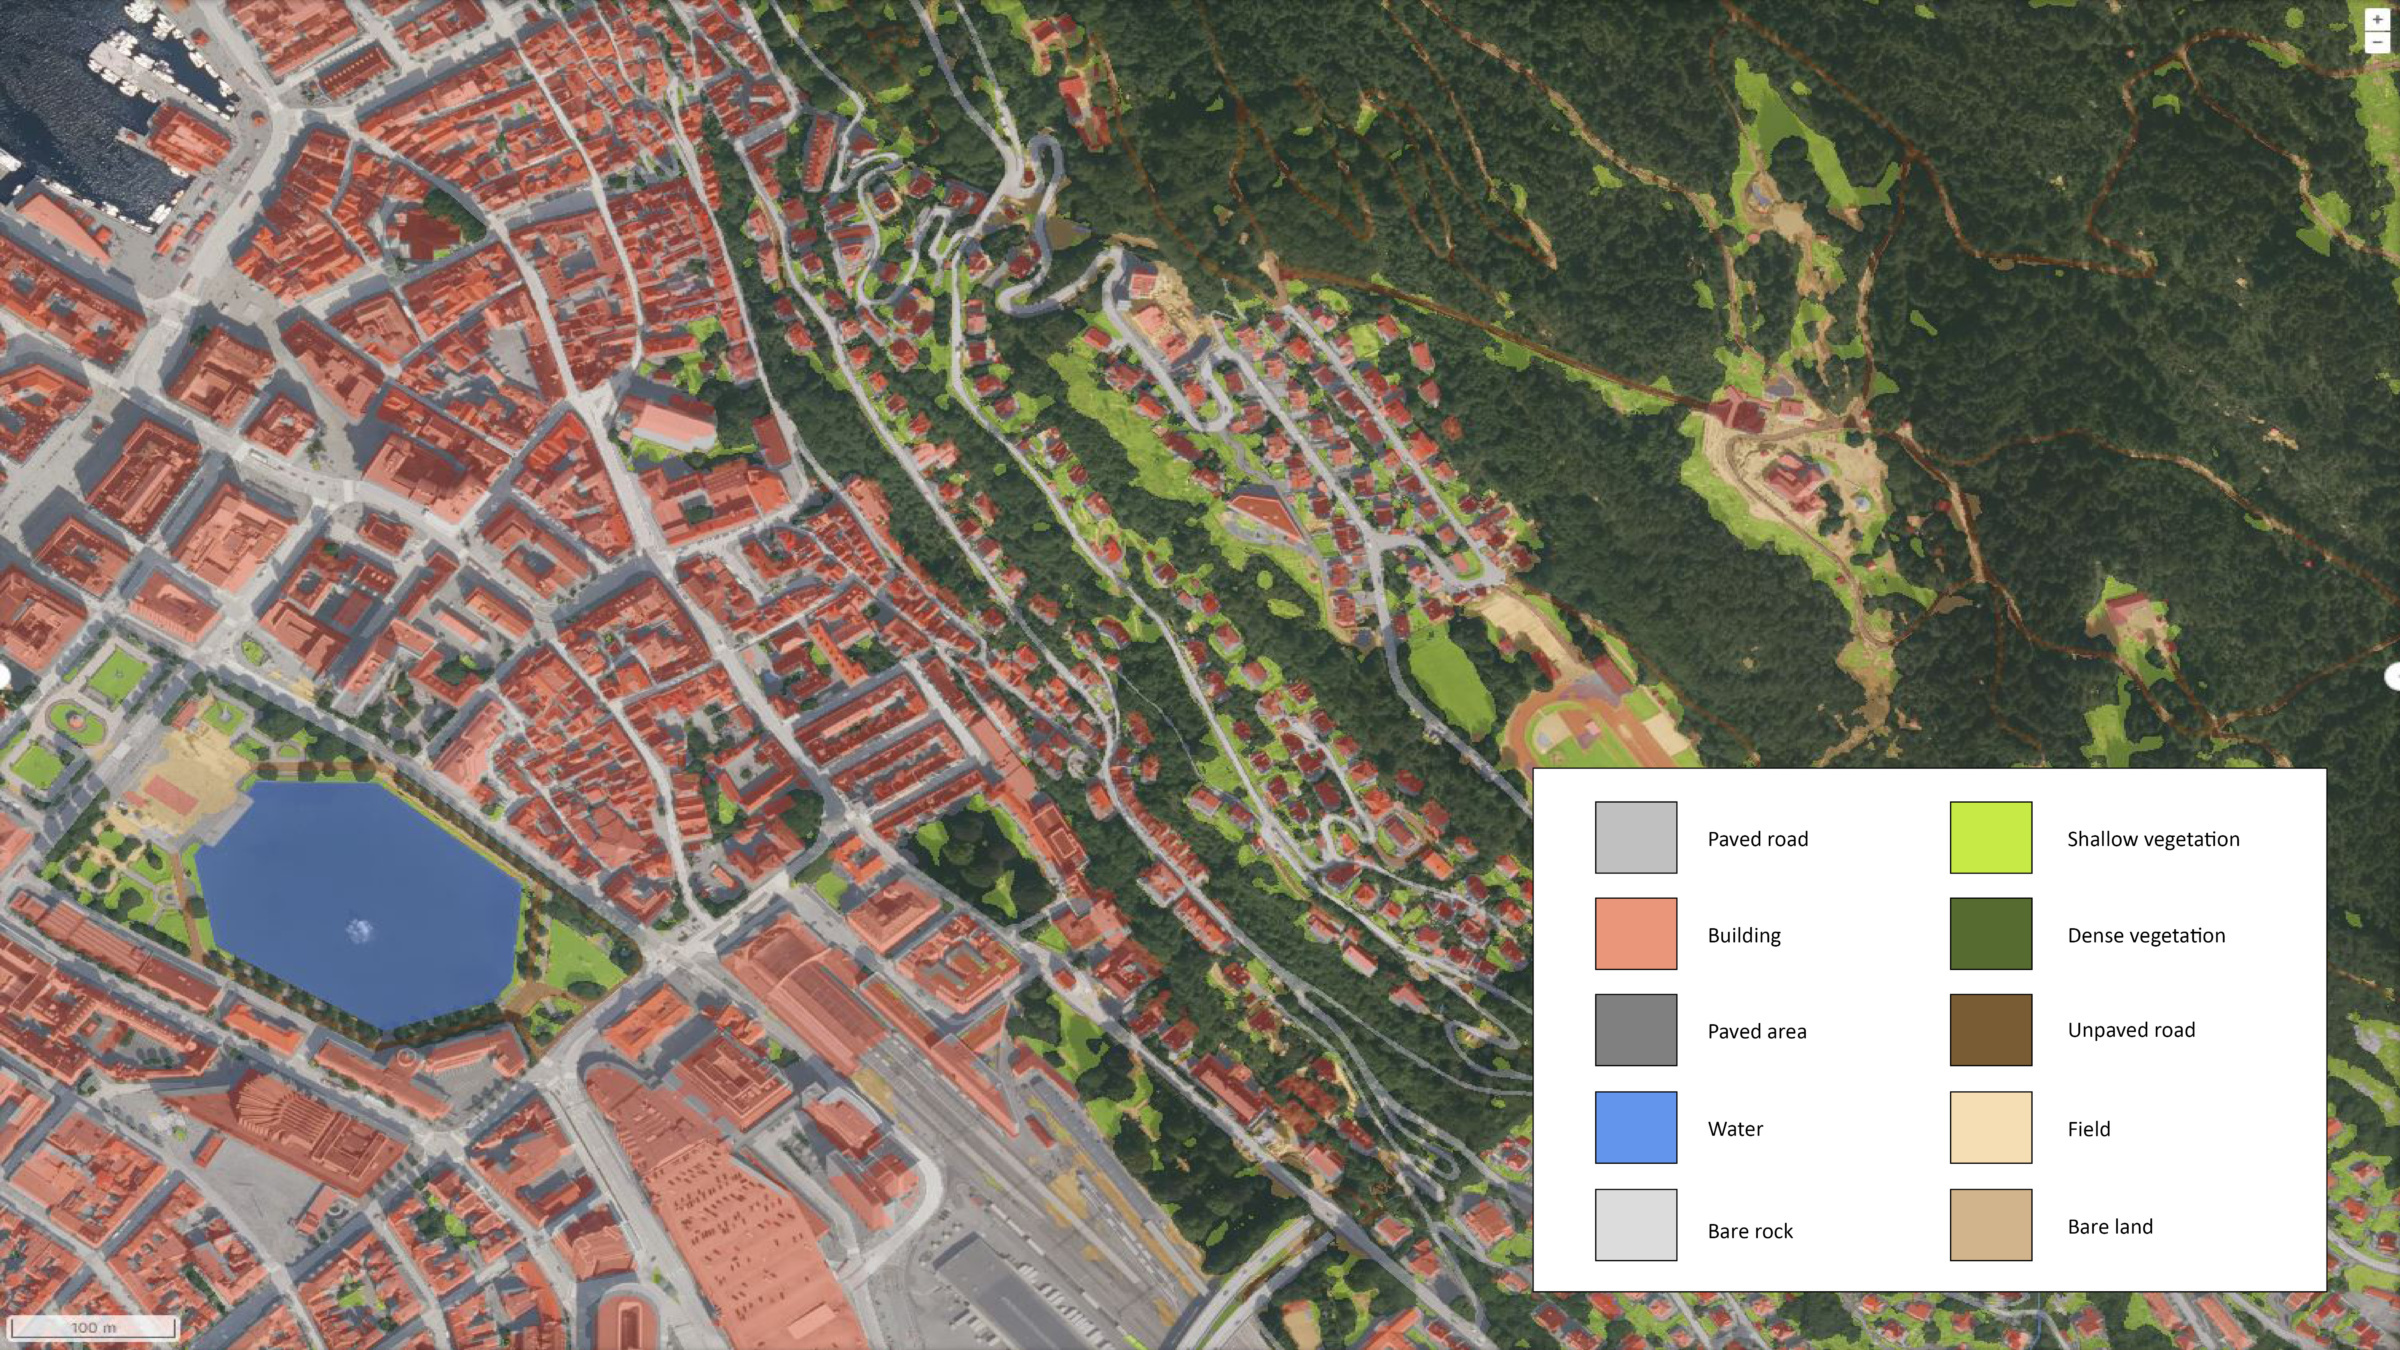
We are happy to announce that SCALGO Live in Finland has been updated with a new land cover map covering the entire country. The land cover map is produced using a machine learning model developed by SCALGO, in close collaboration with SYKE (The Finnish Environment Institute).
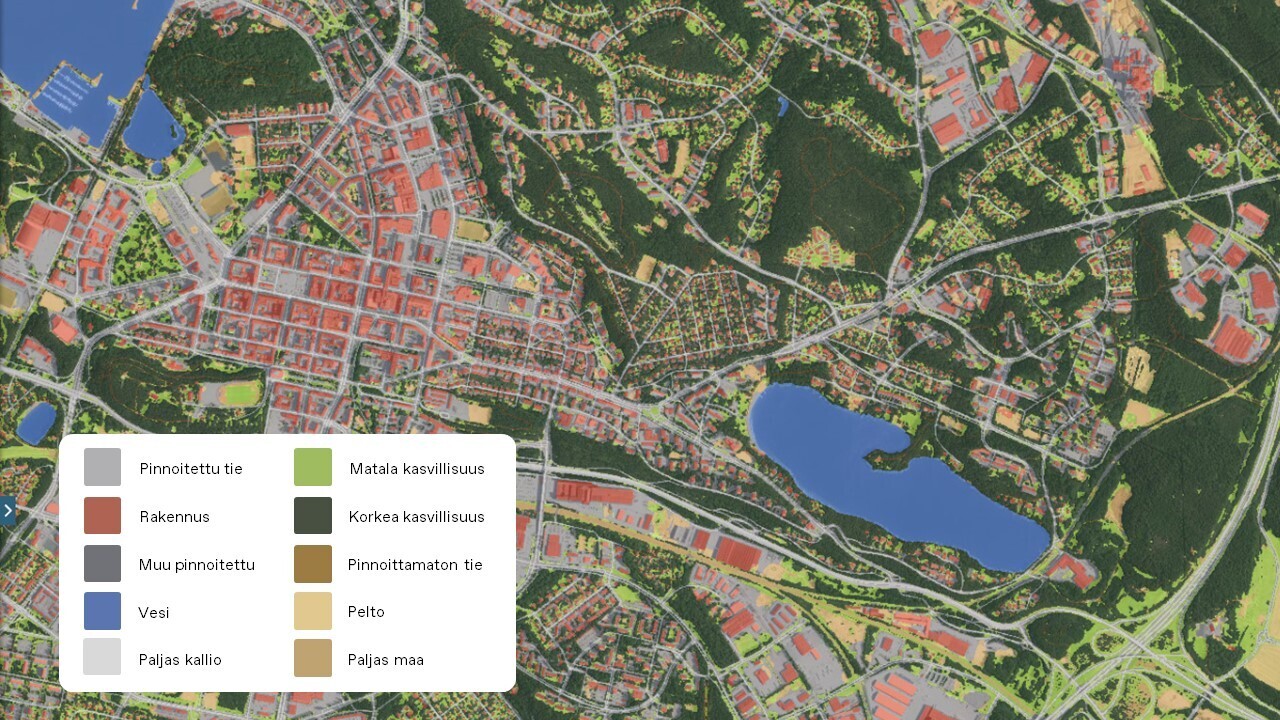
The new map is based on a powerful machine learning model that allows us to classify each pixel into the following categories: impervious, shallow vegetation, dense vegetation and bare land. These four land cover classes are supplemented with auxiliary data from DigiRoad and Maastotietokanta, to create a map with 10 unique classes.
The map is fully integrated into SCALGO Live and is, for instance, used to show aggregate land cover information for watershed queries. For more information please read the accompanying blog post.
Depths in the depression map
Now you can work with depths in the depression map.
Recently, we added a new feature to the Depression map based on requests from users. This latest update is, for example, useful when designing ponds and wetlands with focus on biodiversity.
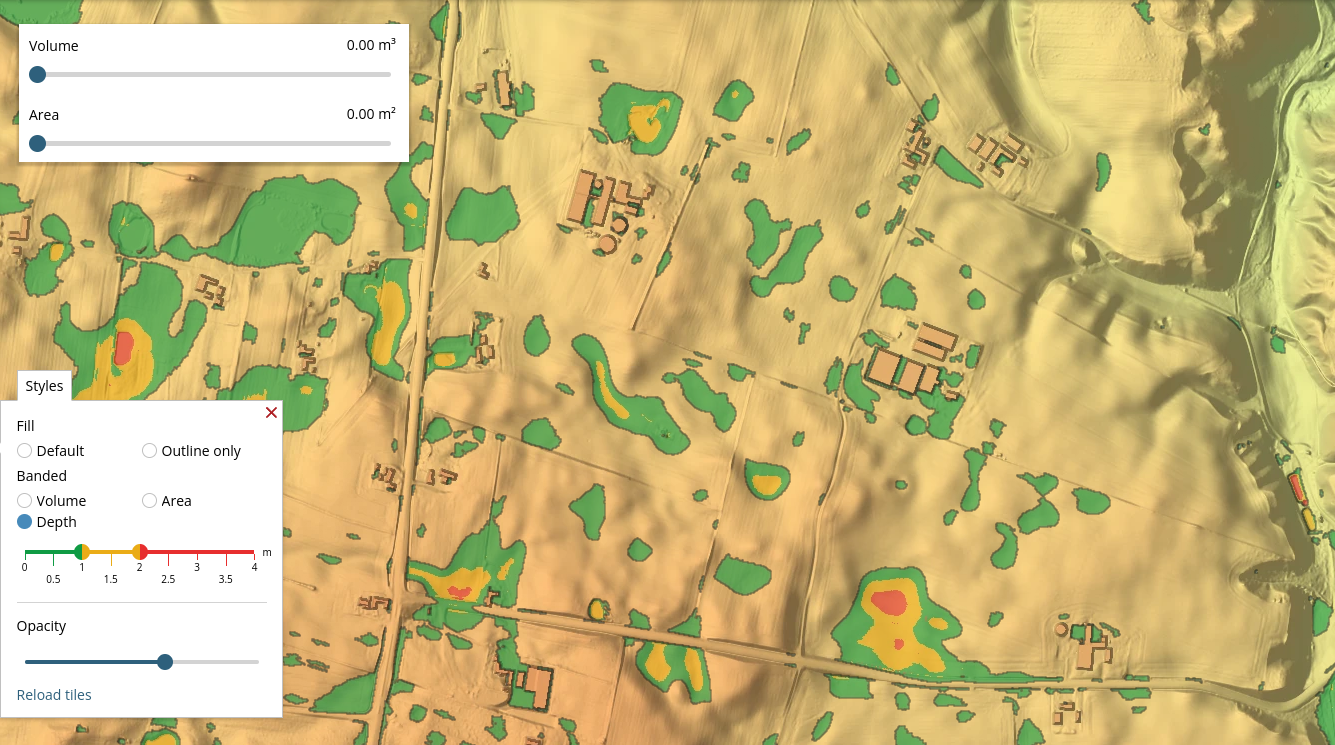
Read the blog to see how to get more out of the depression map in your projects.
New Danish land cover map with more classes
We have released a major upgrade to our nationwide Danish land cover map. The previous map was based on a machine learning model that could distinguish between pervious and impervious areas, on top of this we added data from GeoDanmark to enrich the map with forest, building and surface water (lakes) classes.
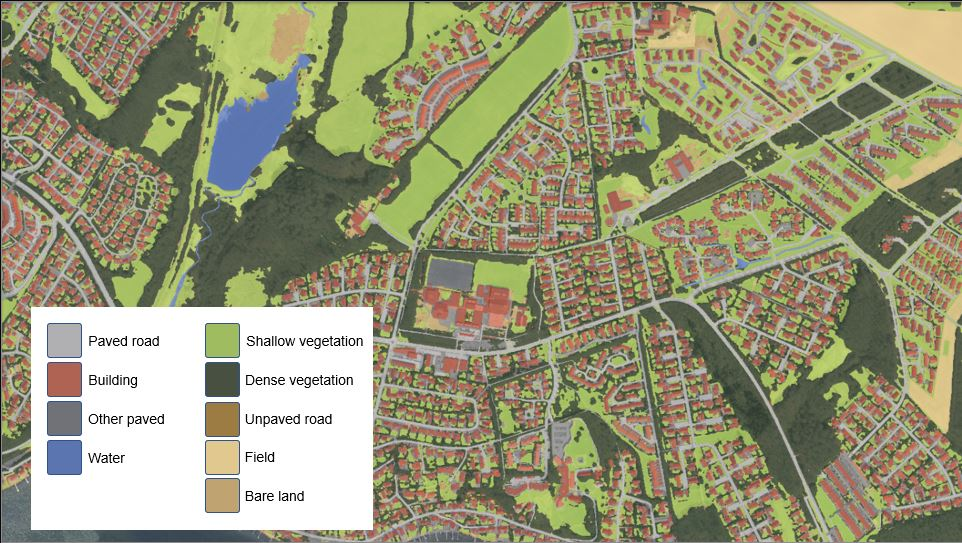
The new map is based on a much more powerful machine learning model that allows us to classify each pixel into the following categories: impervious, shallow vegetation, dense vegetation and bare land. On top of this we have added an expanded set of GeoDanmark classes to mark buildings, agricultural fields, surface water (now also from streams) as well as paved and unpaved roads. The result is a high-resolution national land cover map with 9 classes, as summarised in the below graphic.
We have also upgraded the Flash Flood Map to use the new classes, and in particular we are excited about the dense vegetation class that replaces the forest polygons, providing a much better mapping of those high-infiltration areas.
For more information please read the accompanying blog post (in Danish).
National Swedish High-Resolution Impervious Surface Mapping
Today we announce the availability of a nationwide high-resolution mapping of impervious surfaces for SCALGO Live in Sweden. The map, produced by SCALGO, is based on machine learning techniques and has a resolution of 25cm.
It is available as a standalone layer in the Imperviousness category in the library.
The new imperviousness map is fully integrated into the watershed query tool, allowing you to easily get the total area of impervious surfaces in the watershed and is included, and editable, in newly created workspaces.
For more information, please see the complete release announcement.
Watershed tool updated with even better descriptions of catchment characteristics
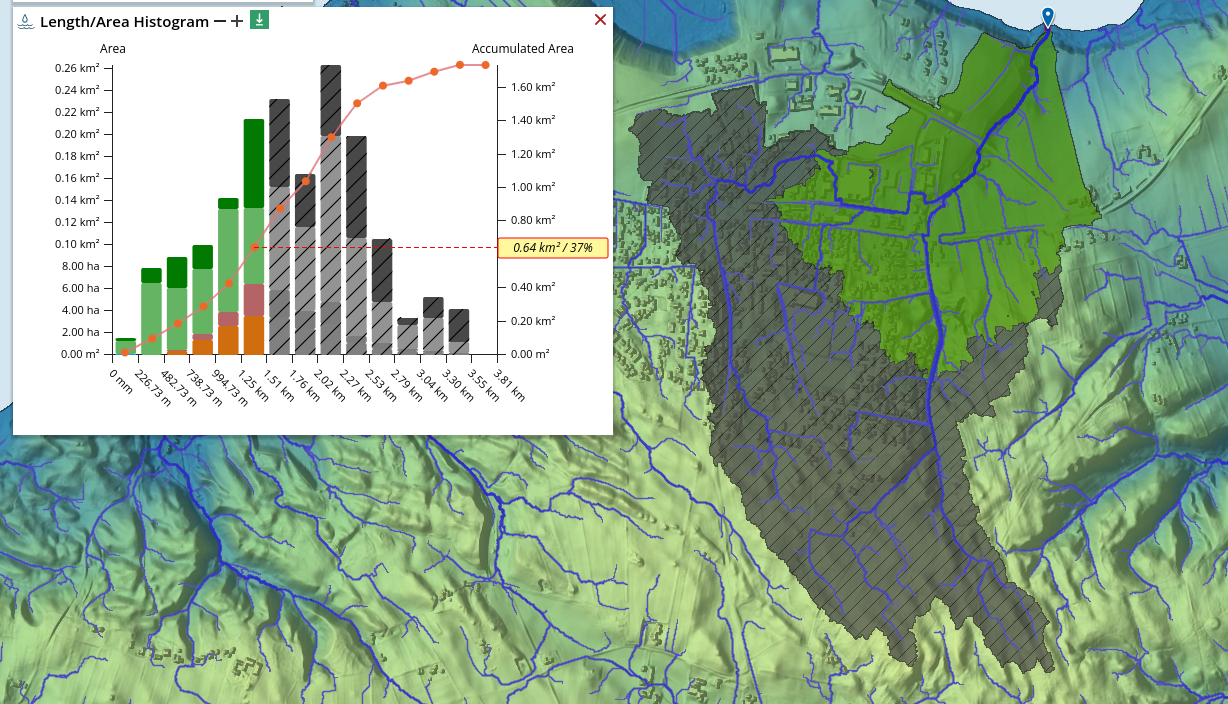
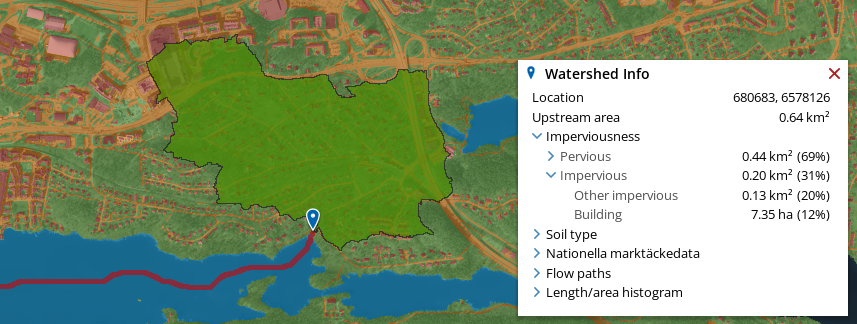
The Watershed tool now supports an expanded set of catchment characteristics that enable you to gain an even deeper understanding of your watershed. When you query a point with the Watershed tool you can now choose to see the longest upstream flow path to that point including both the flow path length and the average slope along the flow path.
If the longest flow path is not enough, we give you the Length/area histogram. This histogram describes how the area of the watershed is distributed across flow path lengths. Why is this useful? Because all watersheds are unique and have very different shapes (even if they have the same longest flow path length), and this ultimately affects runoff behaviour.
You can read more about this updated version of the Watershed Tool in our blog.