About – What's New
National Flash Flood Map with Infiltration and Drainage for Denmark
We have just released a new variant of the Flash Flood Map for our users in Denmark. This variant accounts for infiltration and drainage to sewer systems. This is a big step towards providing more realistic run-off and flood extents in SCALGO Live especially for small rain events.
You can read more about the new variant of the Flash Flood Map in our blog post (in Danish).
Not in Denmark? Do not despair! We are working hard to bring this powerful, yet simple, version of the Flash Flood Map to other countries.
Add your own WMS layers to SCALGO Live
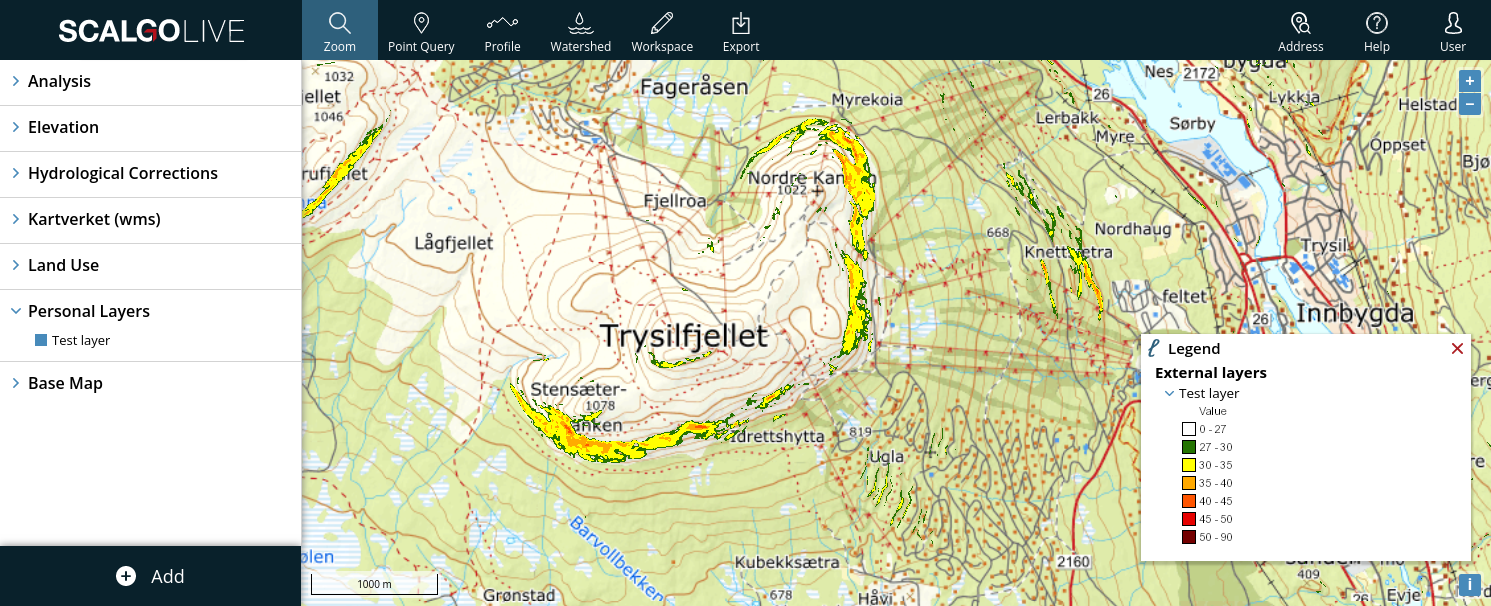
Do you have some externally hosted data you would like to see in SCALGO Live? It's now possible for you to add WMS layers - an open standard for sharing maps on the internet - through the account dashboard. You can read more about how this works in the documentation.
WMS Layers show up in the "Personal Layers" category in the dock. Not seeing it? Look in the library and see if you can find it there. If your WMS layer has a legend, this legend is also shown inside SCALGO Live. You can also include these layers in the maps you export from inside SCALGO Live.
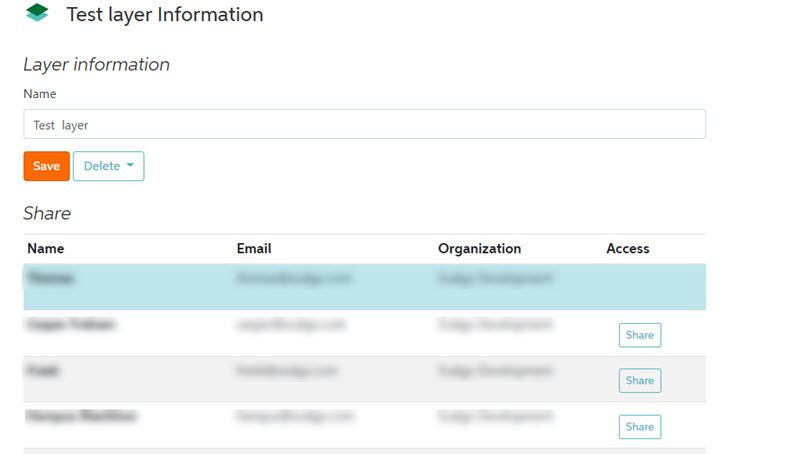
Want to share your favorite WMS layer with a colleague? You can easily do this through your account dashboard as well:
Interested in going the other way? Remember that you can easily integrate your SCALGO Live layers into GIS, or other software that supports the so-called WMTS standard, by creating a ticket and using our WMTS service.
If you have any questions or issues with WMS layers, don't hesitate to contact us.
Easier access to source layers
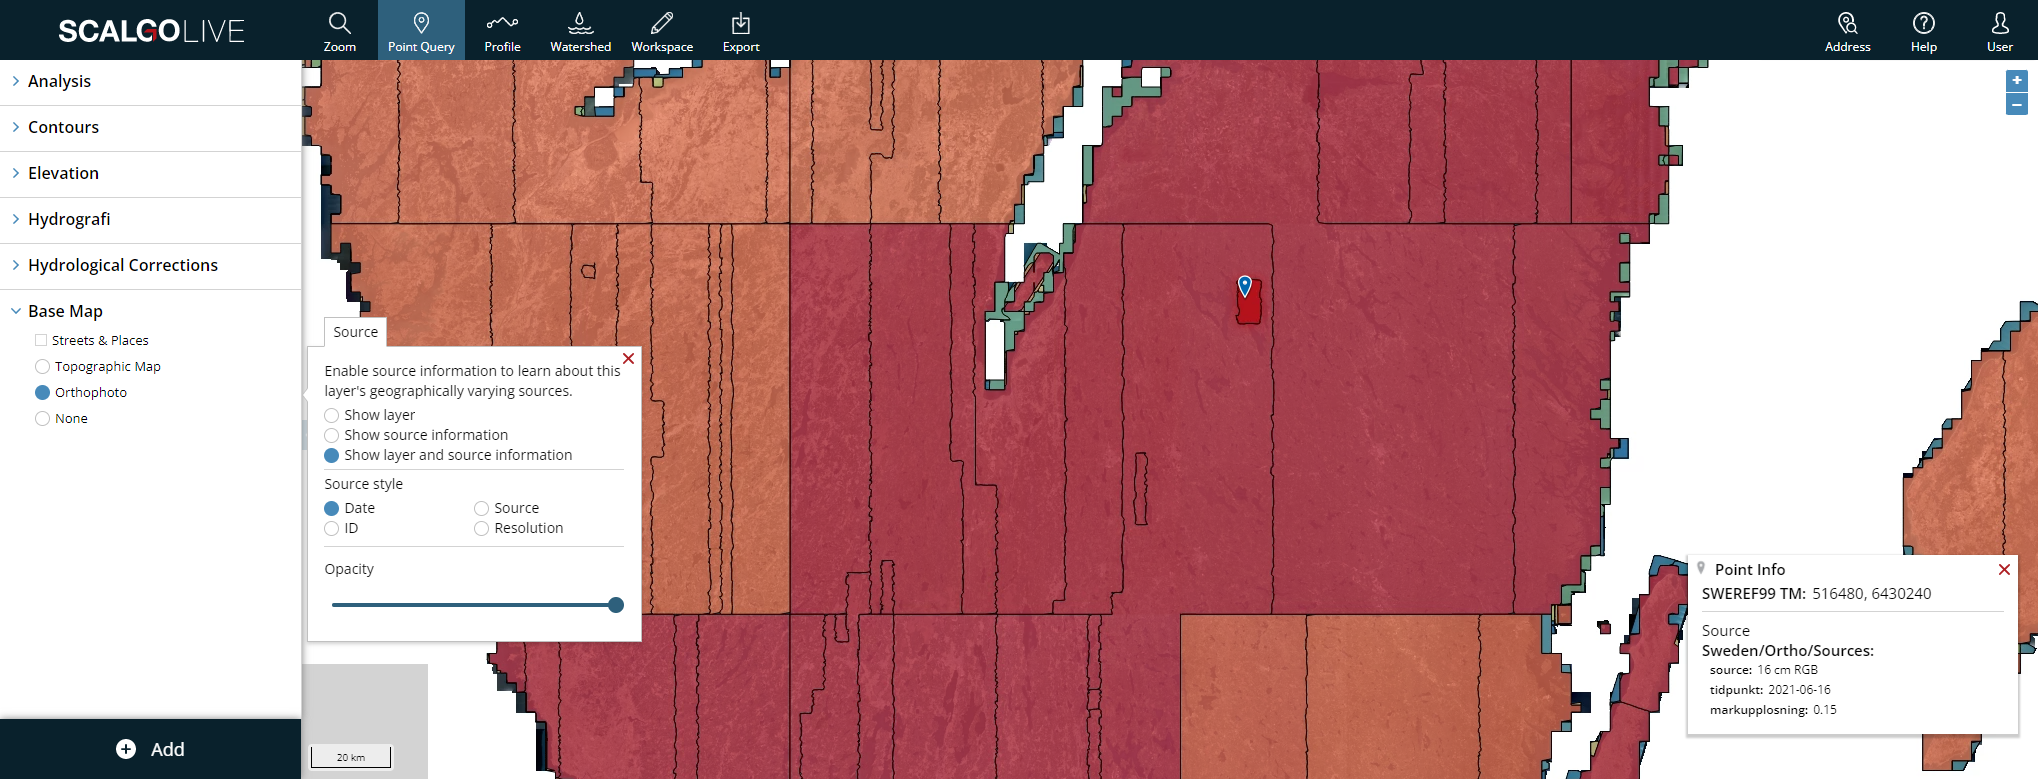
We've assembled many of the elevation models and orthophotos in SCALGO Live from a variety of different spatial data sources with different resolution, source and acquisition time. For many of these we generate a sources layer that allows you to explore this information. Previously, this source data was available in a layer you had to find in the Library, which was not very discoverable. You can now find source information, for the layers that support it, on the gear-menu for the layer in question. This will make it easier to find and access source information in the future.
Enriched building data in Denmark
We have enriched our Danish building layer from GeoDanmark with information from the BBR (Bygnings- og Boligregistret, the Danish Building and Housing Registry) database. When you use the point query tool on a building you now also see information from BBR, including:
- Whether the building has a basement, and how big the basement is.
- The usage class of the building.
- The construction year.
- The postal address.
- a link to the building's. BBR page.
- links to the national property value assessment system.
This information is also available if you download building-specific flooding information from the Flash Flood Map, allowing you to further qualify the damage assessments for affected buildings.
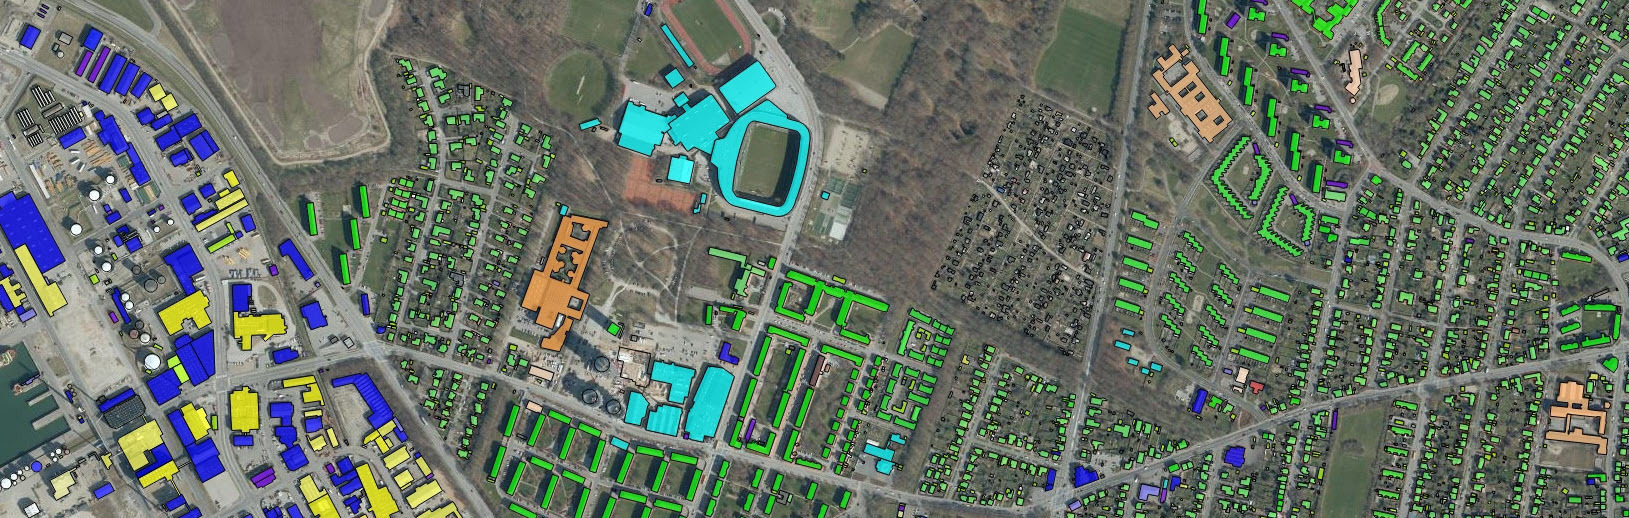
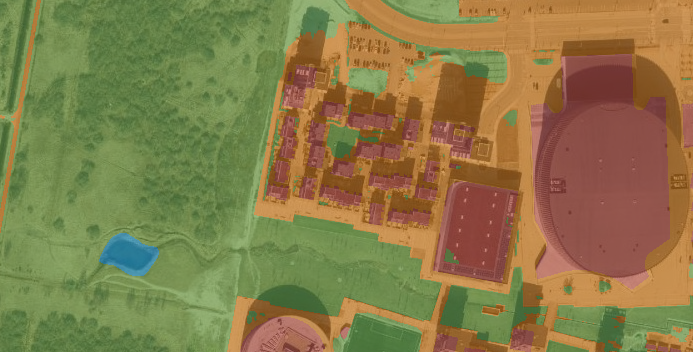
We also have used this new information to enrich the way the building layer is rendered. By default, buildings are now rendered by usage. Blue is commercial, green residential, yellow industrial, purple infrastructure, red health care, orange education and light blue is cultural:
If you are interested in whether a building has a basement or not, there's a rendering mode just for you. Buildings in red have a basements, the rest do not:
And finally, if you want to gauge the age of the buildings in the area, you can render by construction year:

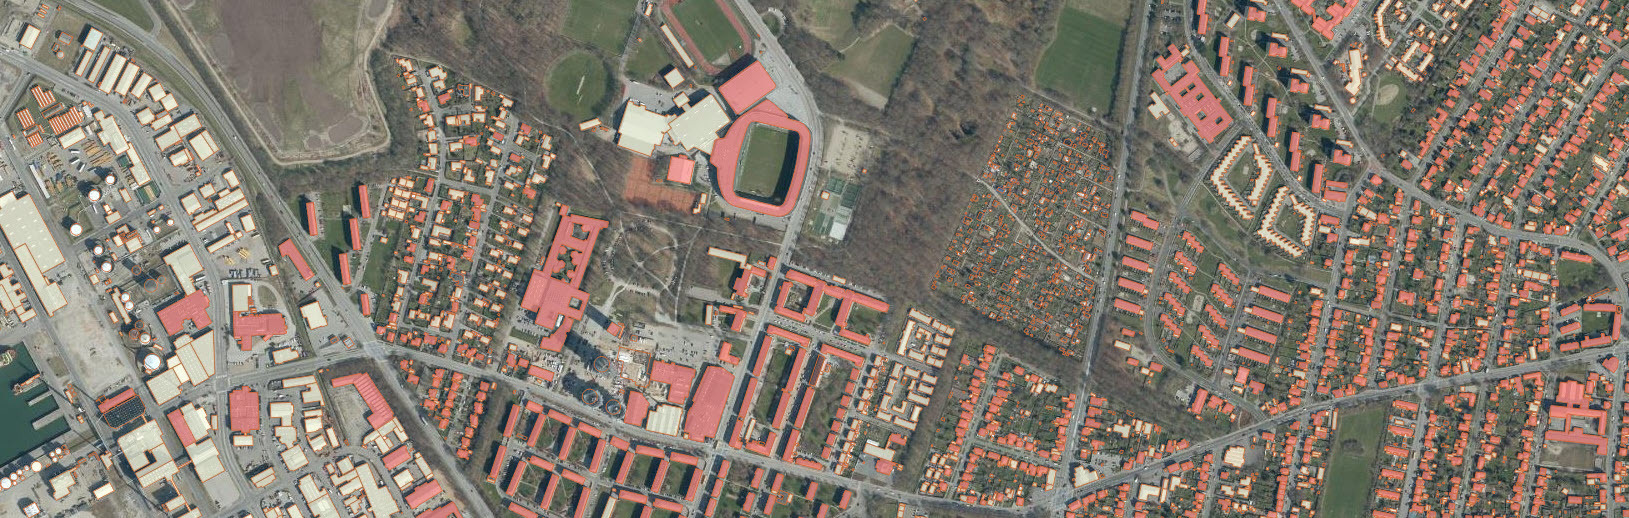
If a GeoDanmark building does not have an associated BBR entry, it it rendered as an outline only in these modes.
National hydrological corrections and Land Cover for Poland
We frequently update the Polish model as new input data (e.g. elevation data) become available. However, today we are releasing a particularly exciting new update of our Polish setup. We have produced a national set of so-called hydrological corrections for all of Poland, and we have also added a national land cover map - both based on GuGiK BDOT10k data.
Hydrological corrections
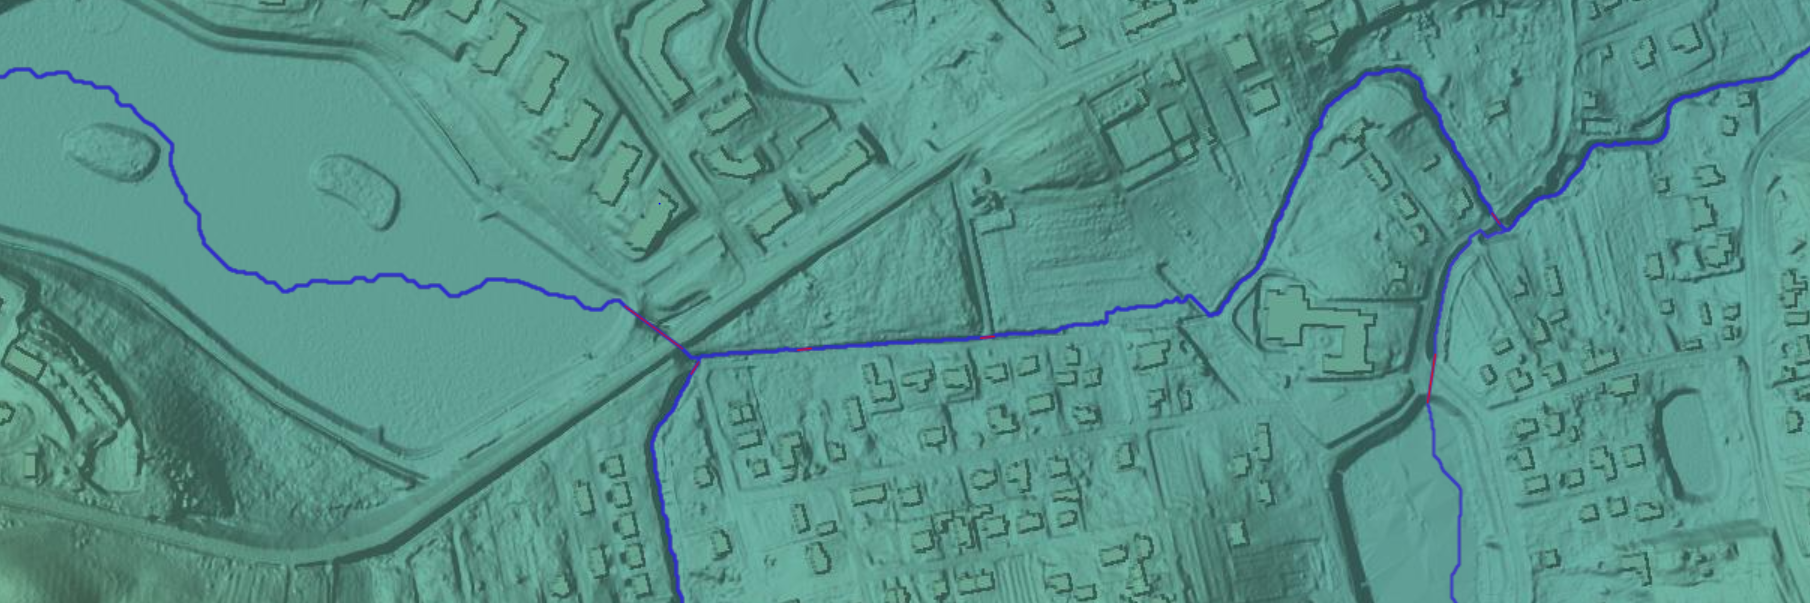
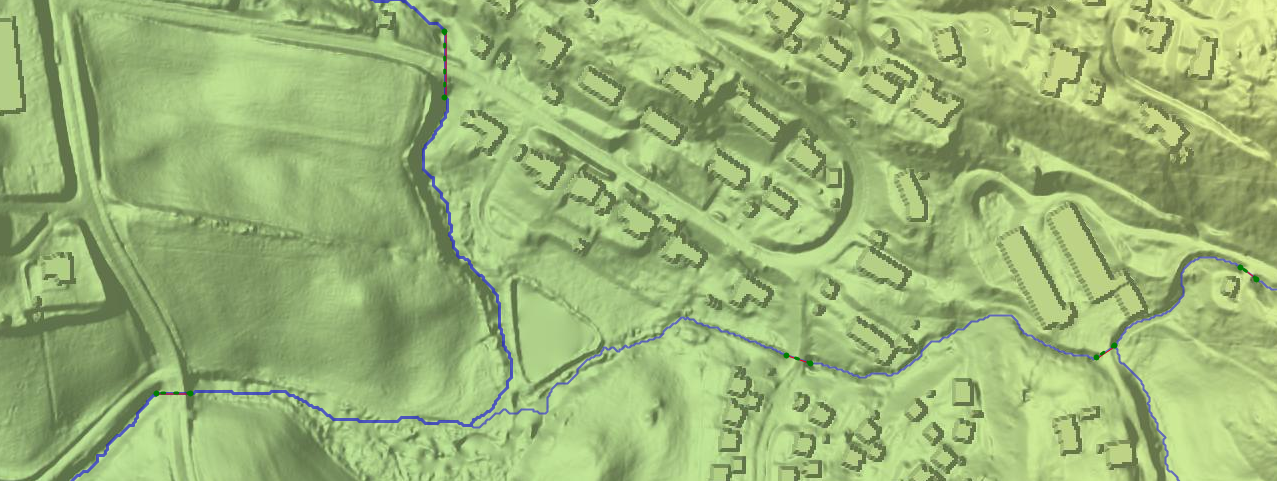
Hydrological corrections make it possible to model water that flows under objects like bridges that otherwise appear as barriers in the elevation model. For instance, when a stream crosses a road under a bridge, the elevation model could make it look like there is a blockade since the space under the bridge is not represented. Our hydrological corrections should result in improved flow routing in many places in the country, particularly where bridges and underpasses intersect flow paths.
If you want to learn more about how the corrections were generated, please consult the corresponding section in the documentation. The hydrological corrections are used in our analyses and are automatically included in newly created workspaces where they can be altered if need be.
National land cover data
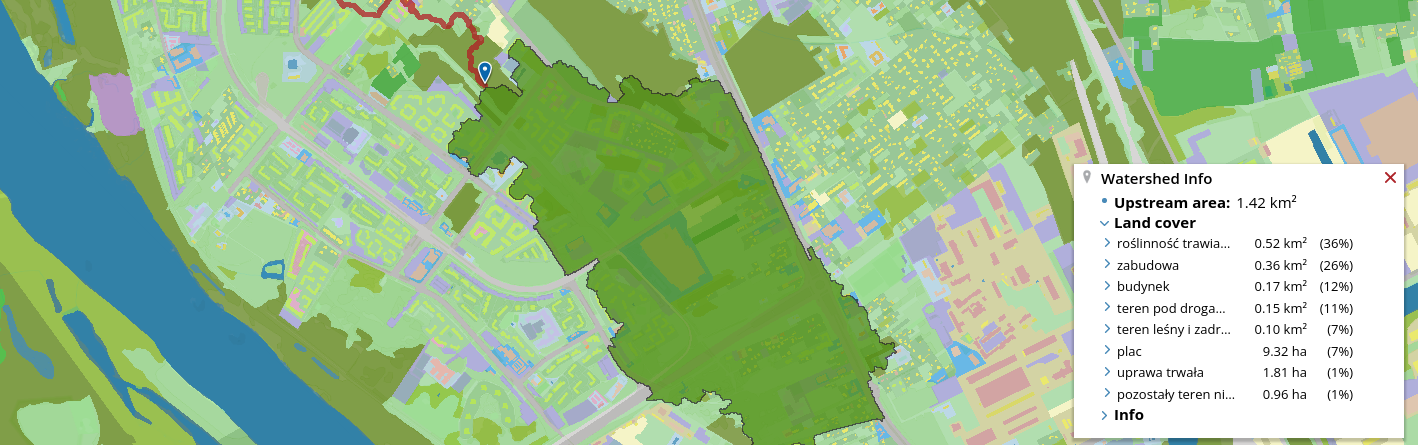
We have built a national land cover layer from BDOT10k. This means you will now get information about the land cover composition of any watershed you select using the watershed tool. Additionally, you can easily add infiltration to Flash Flood Maps in your workspaces by picking different runoff functions for the various land use categories. Not happy with our land cover map? You can edit it freely using our powerful edit tools in workspaces.
For more information about adding infiltration to your Flash Flood Map, and about editing land cover data, please consult our recent release notes on the subject.
National hydrological corrections for Norway
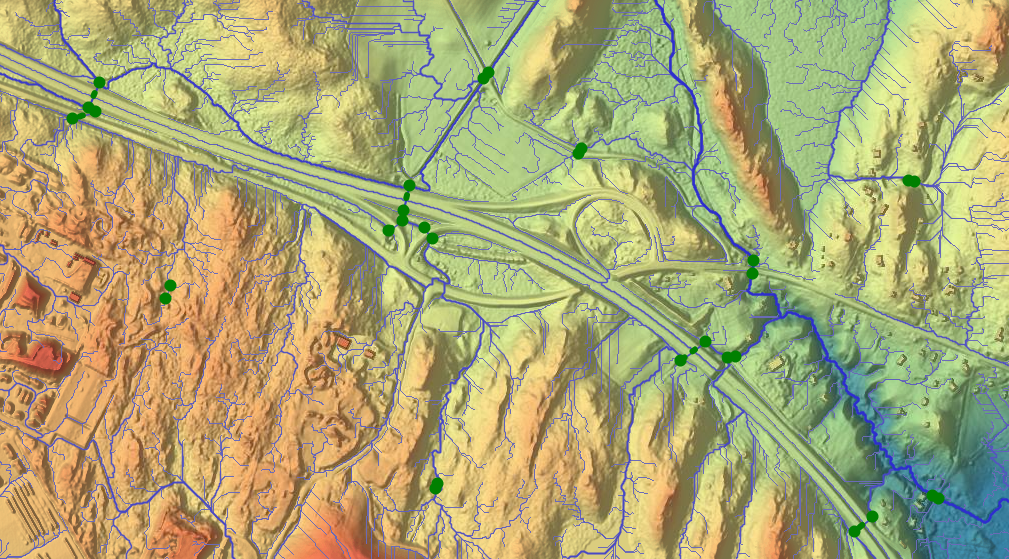
We frequently update the Norwegian model as new input data (e.g. elevation data) become available. However, today we are releasing a particularly exciting new update of our Norway setup. We have produced a national set of so-called hydrological corrections for all of Norway. These corrections should result in improved flow routing in many places in the country, particularly where bridges and underpasses intersect flow paths.
What are hydrological corrections?
Hydrological corrections make it possible to model water that flows under objects like bridges that otherwise appear as barriers in the elevation model. For instance, when a stream crosses a road under a bridge, the elevation model could make it look like there is a blockade since the space under the bridge is not represented.
If you want to learn more about how the corrections were generated, please consult the corresponding section in the documentation. The hydrological corrections are used in our analyses and are automatically included in newly created workspaces where they can be altered if need be.
Updated Impervious Surface Mapping for Denmark
We have released an update to our high-resolution impervious surface mapping for Denmark. The mapping is now based on data from 2020, a significant update to the previous mapping, released last year, that was based on data from 2014-2016. Besides being based on more recent data, we have also updated our methods to create an even better impervious surface mapping.
It is also used in newly created workspaces. In workspaces you can update your land use mapping to fit your particular project, using our new land use edit tools.
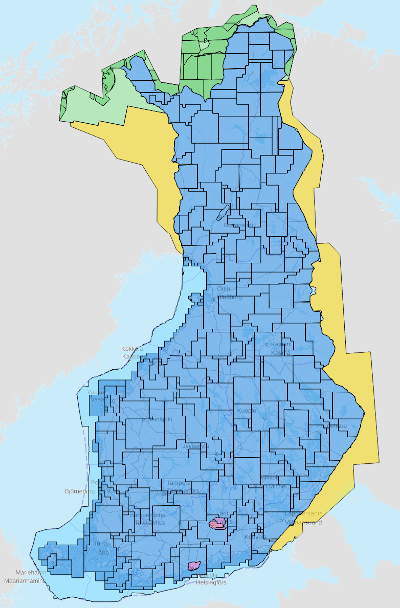
National hydrological corrections and updated local data for Finland
We have released a significant upgrade to the Finnish model in SCALGO Live. We have included new elevation data for Helsinki and Lahti, and we have produced hydrological corrections for the entire country which we have used in the analysis.
Hydrological corrections
Hydrological corrections make it possible to model water that flows through supposed obstacles in the elevation model that actually allow water to flow in reality. For instance, when a stream crosses a road under a bridge, the elevation model could make it look like there is a blockade since the space under the bridge is not represented.
We treat hydrological corrections as logical structures that allow water to flow from one end to the other, they typically do not alter the elevation model itself. Thus, waterways can cross in SCALGO Live — a very powerful feature. For instance, water can flow on top of a bridge in the direction of the road, and at the same time a river can cross the road under the bridge in a different direction. Hydrological corrections have infinite transport capacity, we do not model flooding from e.g. under-dimensioned culverts and bridge openings.
When you create a workspace, the hydrological corrections are included automatically, unless you create a model from a custom DEM or through the "Existing model" feature — in that case you can choose to import corrections directly from the workspace itself.
Updated elevation data for Helsinki and Lahti
For the areas around Helsinki and Lahti, we now use elevation models with a horizontal resolution of 1 meter made available for SCALGO Live users by the respective municipalities. This provides a substantial lift in data quality for users in those areas. In order to incorporate these models, we now represent the whole country in a 1 m model instead of a 2 m model. This also holds for workspaces created from this point onwards.
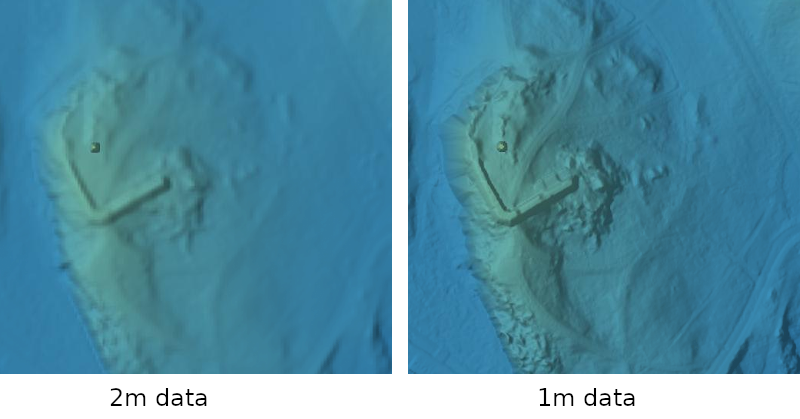
You can see the coverage of the new models in the sources layer in SCALGO Live:
Fast and intuitive tools to work with infiltration and land use
We have introduced a whole new set of fast and intuitive tools to work with infiltration and land use in SCALGO Live. With these tools you can easily define runoff functions and initial losses for different land use types and change land use in your project area to describe planned developments. This helps you get an even better understanding of how surface water may affect your project.
To learn more about these new tools, you can read the manual and you can watch our getting started video that shows the details of how to edit land use, define runoff and see the effect of infiltration.
Improvements to vector imports and exports
We have introduced a number of new options for working with vector data in SCALGO Live.
Better support for import vector formats
We have expanded our support for vector formats when importing data into SCALGO Live, both for visualizing vector data on the map, and for creating new terrain features. In addition to GeoJSON and Shapefile we now also support MapInfo TAB, GeoPackage and DXF. Since the DXF format is not georeferenced, you will have to select a coordinate system when you import the file. Having issues with any of these formats? Write to support and let us know.
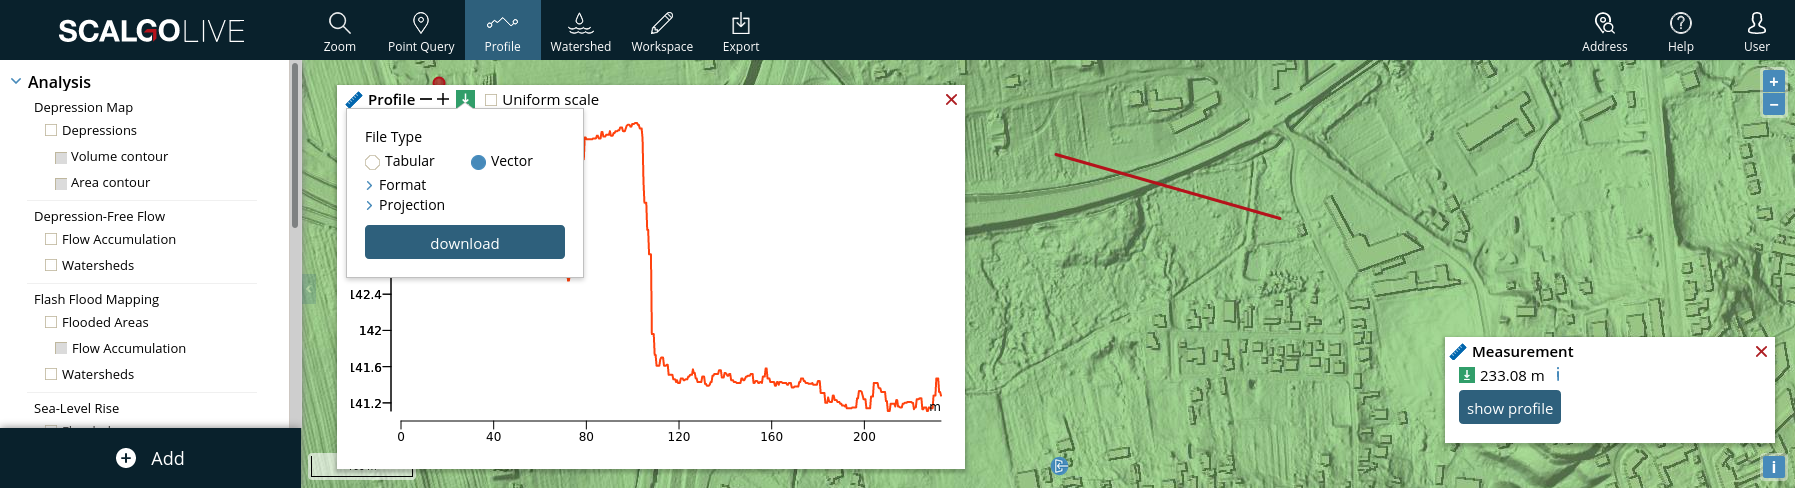
Get three-dimensional geometry from profile window
We have added the option of exporting the data in the profile window as three-dimensional polylines. For example, if you export an elevation profile you will get a polyline with the x,y coordinates following the position of the query path and z being the elevation. If you have multiple profiles in your window you will get a separate polyline for each profile. You can still choose to download the profile information in tabular form where we support CSV and the Excel spreadsheet format (xlsx).
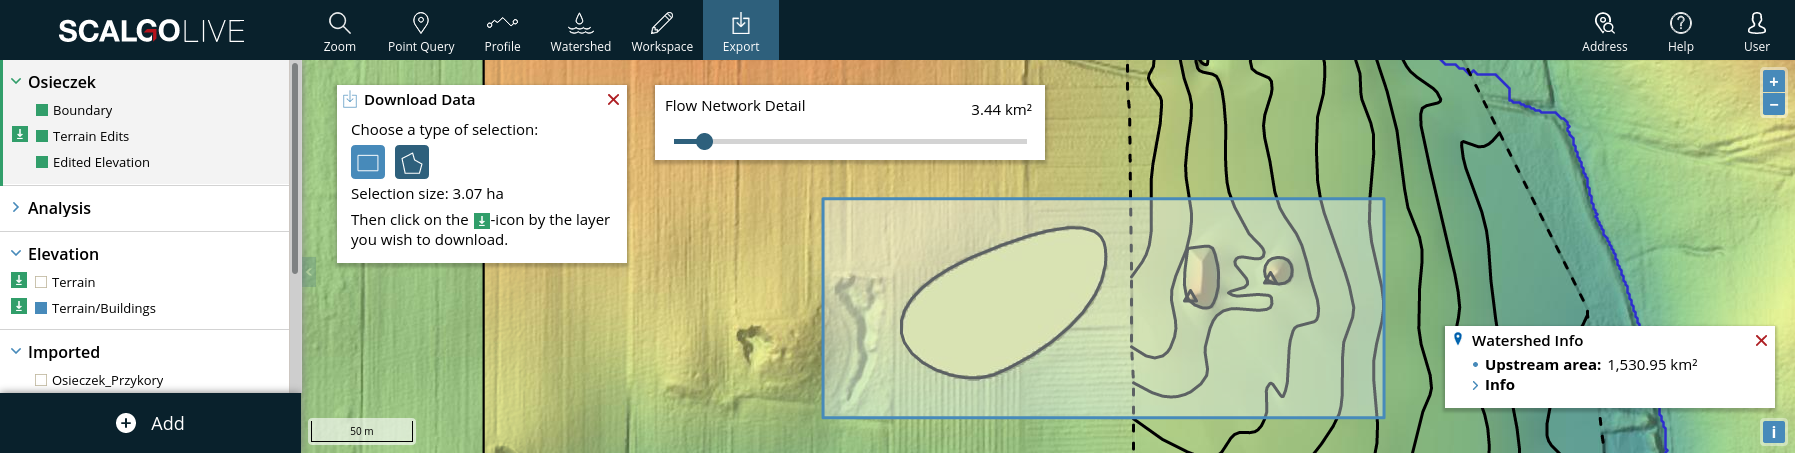
Improved download of terrain edits and query data
You can now download workspace terrain edits in the same way as you would download from other layers in SCALGO Live. First you draw a boundary around the features you want to download using the download tool, and then you click the green icon to the left of the Terrain Edits layer. You then have the option of selecting the file format and projection for the downloaded features. As part of this change the "Export features" action in the workspace menu has been removed.
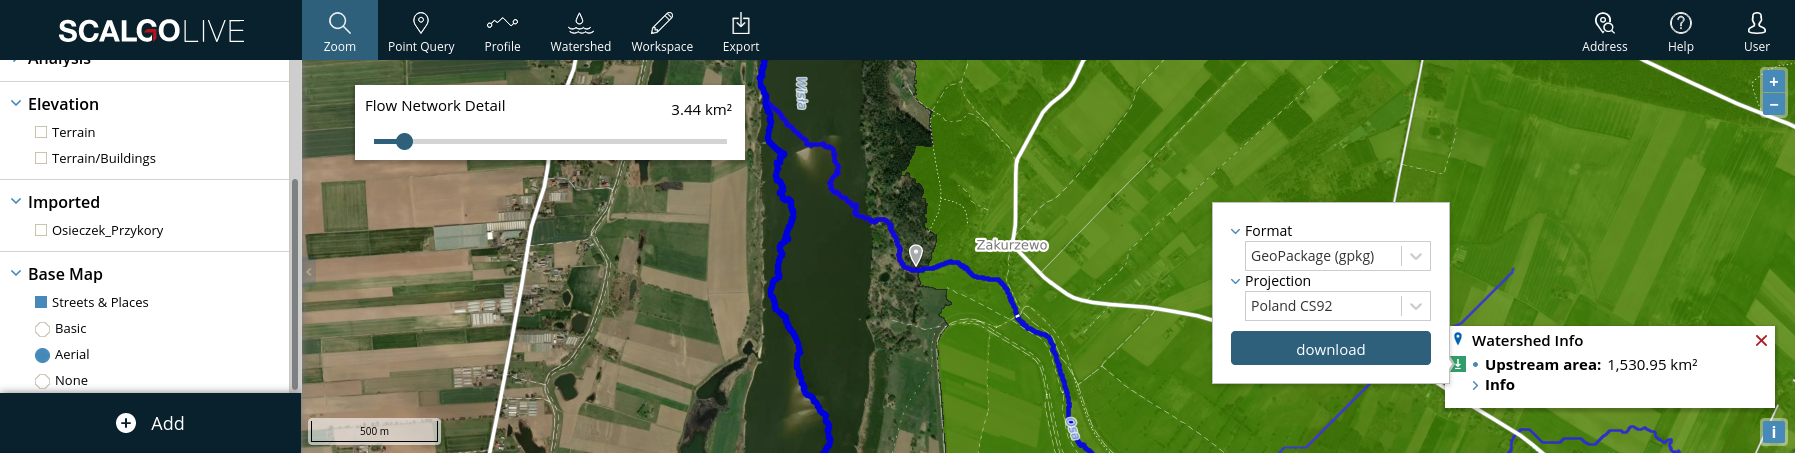
We have also added format and projection selection options for the remaining vector exports in SCALGO Live. Most notably this includes depression queries in the depression map, and watersheds exported through the watershed tool.
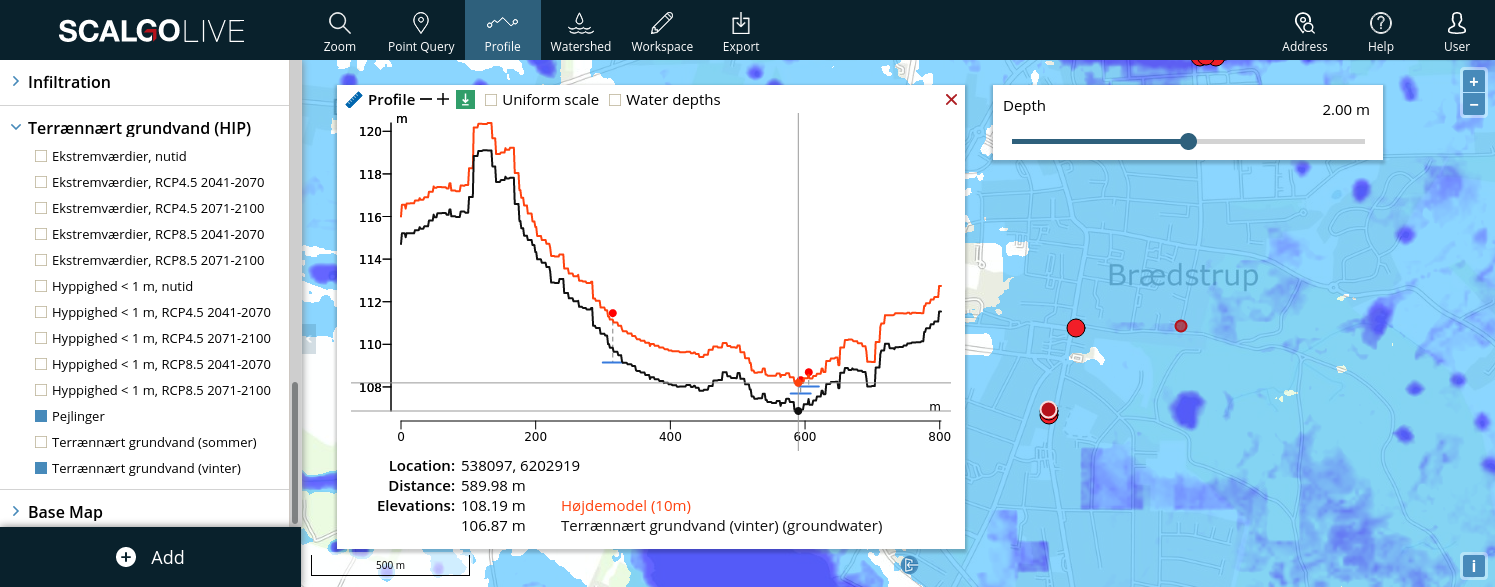
National Danish groundwater model
We have added new Danish national groundwater maps from "Hydrologisk Informations- og Prognosesystem" (HIP) in SCALGO Live. The new layers are integrated with our existing tools to create a powerful way to understand both surface water and shallow groundwater in one place. You can see the groundwater table in our profile tool and filter the groundwater maps based on depth, return period or frequencies. You can also easily understand and get information about the measurement points used the production of the HIP model.
The new layers are available from the library, and all the data can downloaded easily through our regular download system.