About – What's New
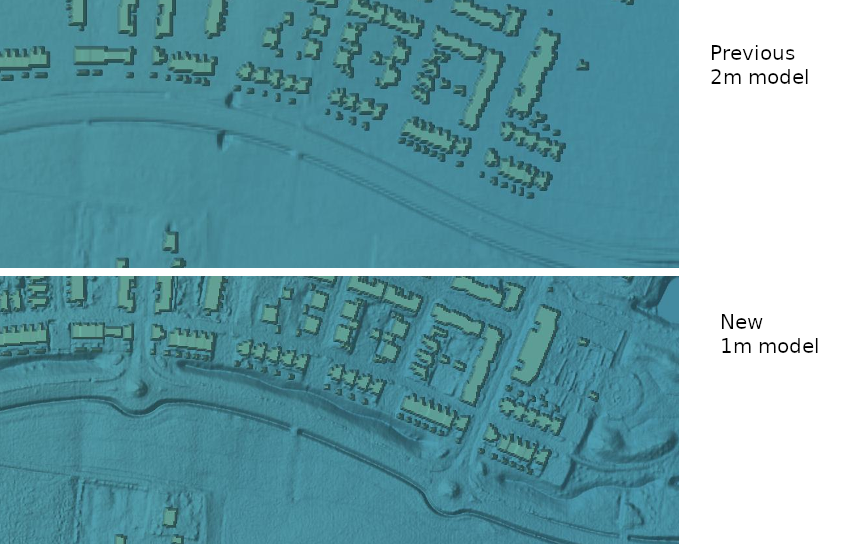
New Sweden high-resolution model
We released a significant upgrade to the Swedish elevation model in SCALGO Live. The new model is Lantmäteriets 1m-resolution Markhöjdmodell Nedladdning, grid 1+ which is based on Laserdata NH and Laserdata Skog. As part of this update we have also added additional corrections along rivers and longer subsurface pipes to the set of conservative corrections used in the national model. Laserdata Skog is continuously updated and thus also Markhöjdmodell Nedladdning, grid 1+ . We will regularly update the elevation model in SCALGO Live to ensure you also benefit from these updates.
We have switched the base map used for showing orthophotos and as a consequence of this, orthophotos can now be downloaded in the same way as most other layers in SCALGO Live. If you want an orthophoto for your report you might still be better off using our export map tool that will give you a georeferenced PDF that is of reasonable size.
The sea-level rise analysis has also been updated and now includes the ability to use a depth filter. The depth filter allows you to hide flooded areas where the water depth is lower than a threshold. This is now also available in workspaces.
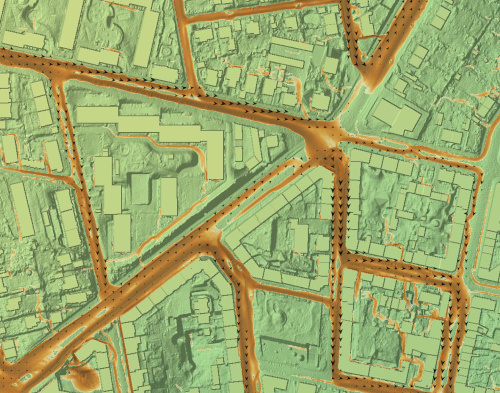
New powerful depression map and more analyses visualization options
SCALGO Live's depression map allows you to investigate the depressions in the terrain and has just become much more powerful. You can now use new volume and area sliders to hide small depressions and focus on the bigger ones. Furthermore, the default rendering style has been changed to a hatched pattern that makes it easier to distinguish between inside and outside of a depression.
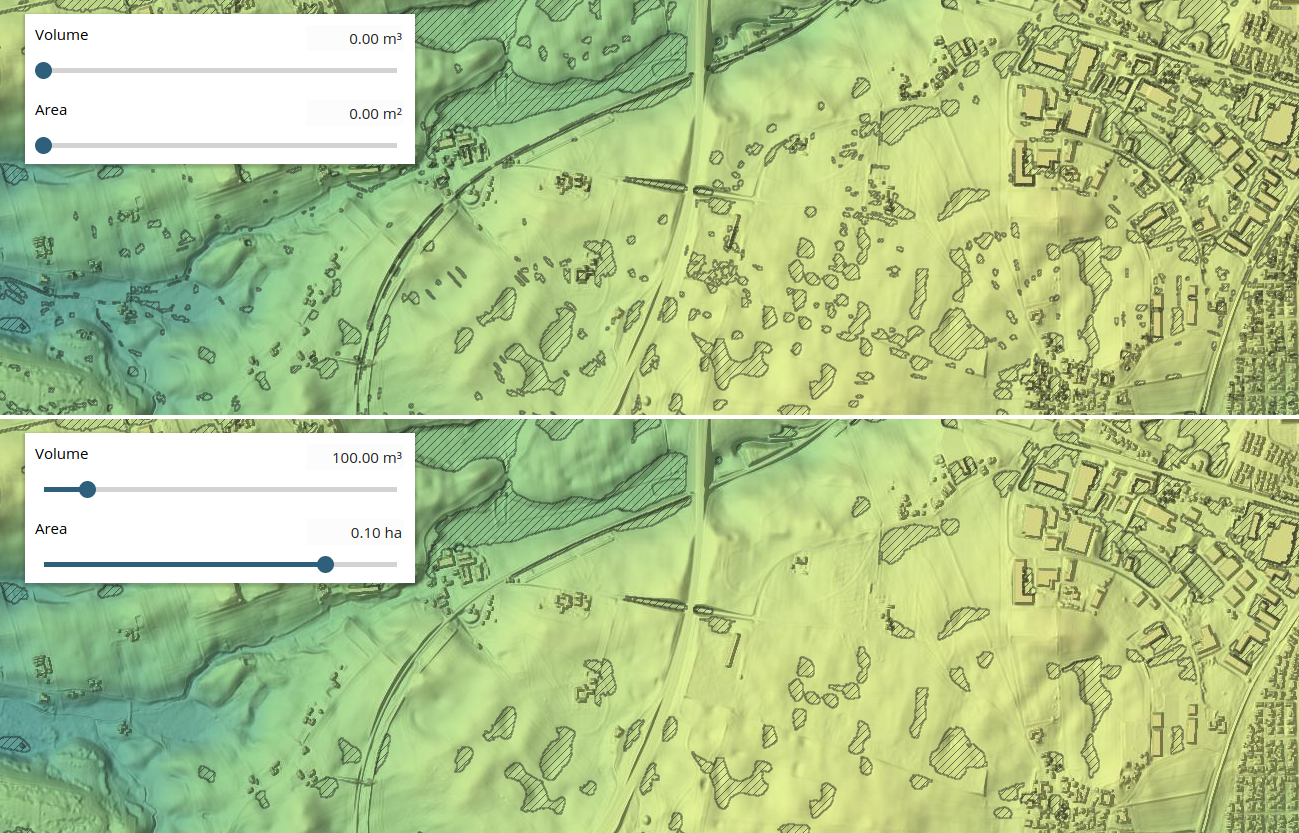
But that's not all, several other interesting features have been added to the depression map:
- On point queries you now get the area of the maximal depression and the area of the selected region as well.
- You can download the map as both an area and volume raster, and as depression polygons annotated with area and volume.
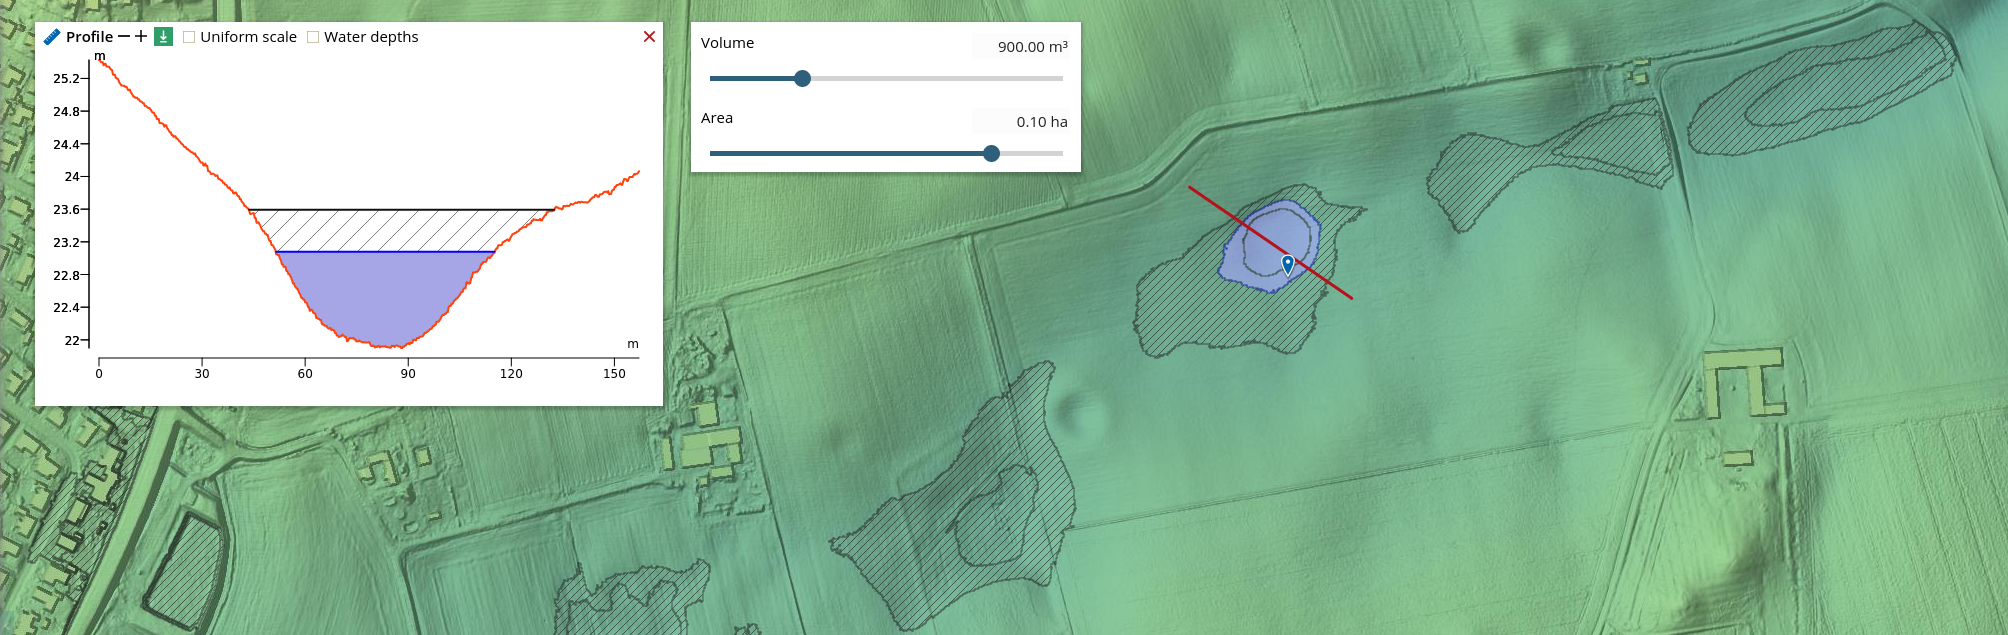
- The profile tool now shows depressions too.
- A banded rendering style is now supported - more on that below. You can use either volume or area to define the bands.
- We now support volume and area contours, allowing you to easily find areas in a depression with a particular capacity.
Some of these features are shown here:
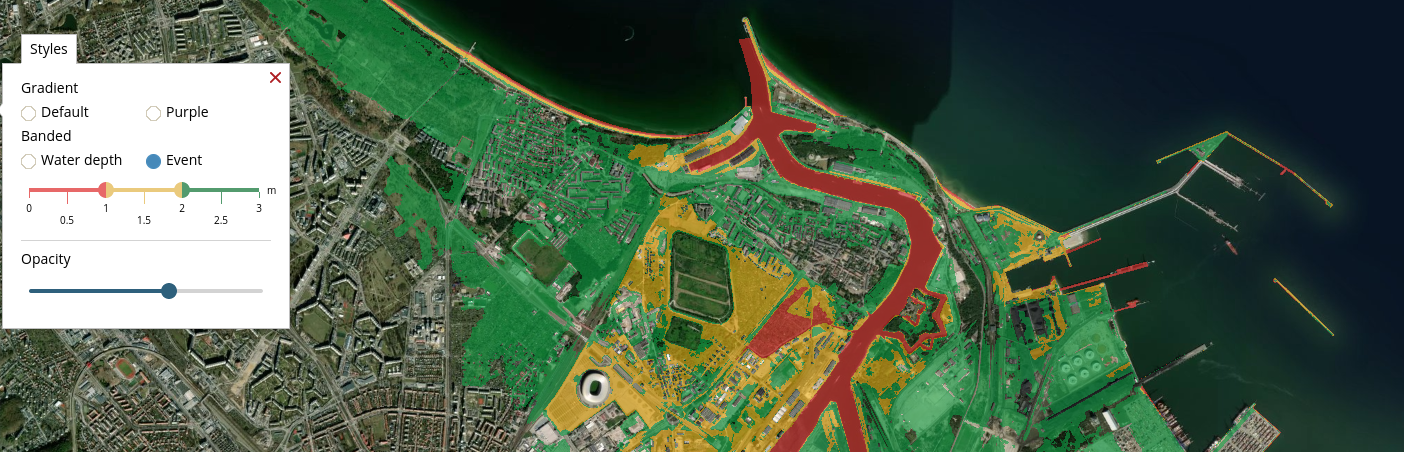
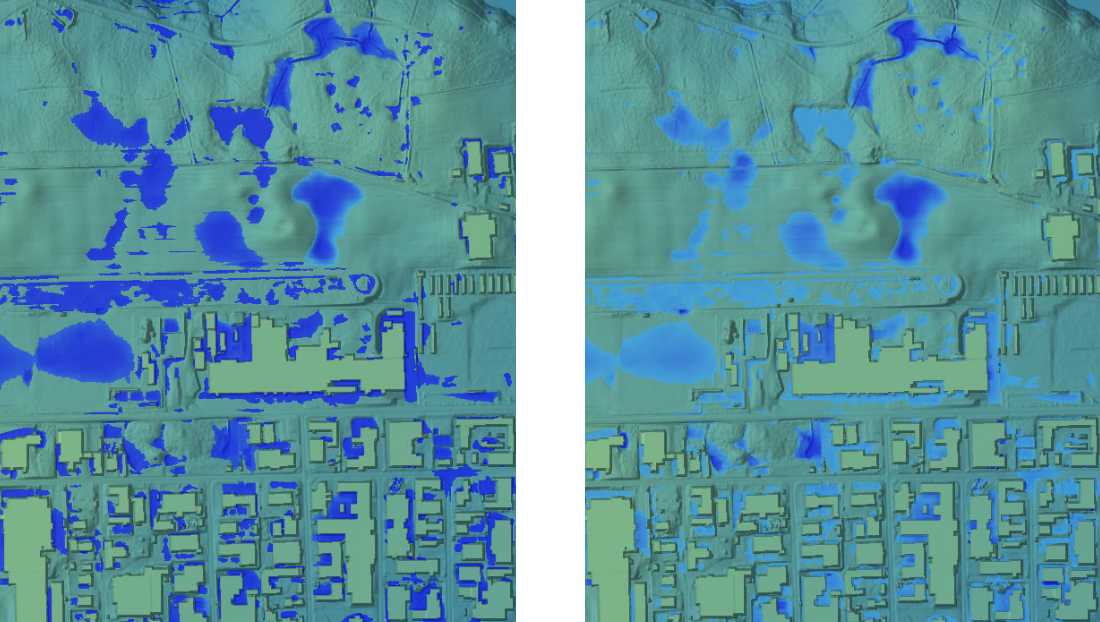
Banded styles for all analyses
We now support banded rendering styles for all analysis layers. Banded rendering allows you to color the analysis layers in three color bands defined by two threshold values on water depth or event. Previously this was possible only for the flash flood map. Furthermore we have tweaked the colour palette to get a nicer looking output. We have also created a colorful slider to help you set the right threshold values.
Introducing Modelspaces: Get your hydrodynamic models into SCALGO Live
With SCALGO Live modelspaces you can now import your hydrodynamic models into SCALGO Live where the simulation results come to life through advanced visualisation, interactive exploration and easy sharing with colleagues, clients and consultants.
You can read more about Modelspaces on the add-on page or get the details in the documentation.
Use case videos
We have made new learning material that demonstrates how you can approach different projects based on concrete use cases. These new use-case videos cover a wide range of topics and demonstrate how the tools in SCALGO Live can be used for different purposes. The videos will give you inspiration about out what projects are possible with SCALGO Live, and provide you with guidance on how to carry them out.
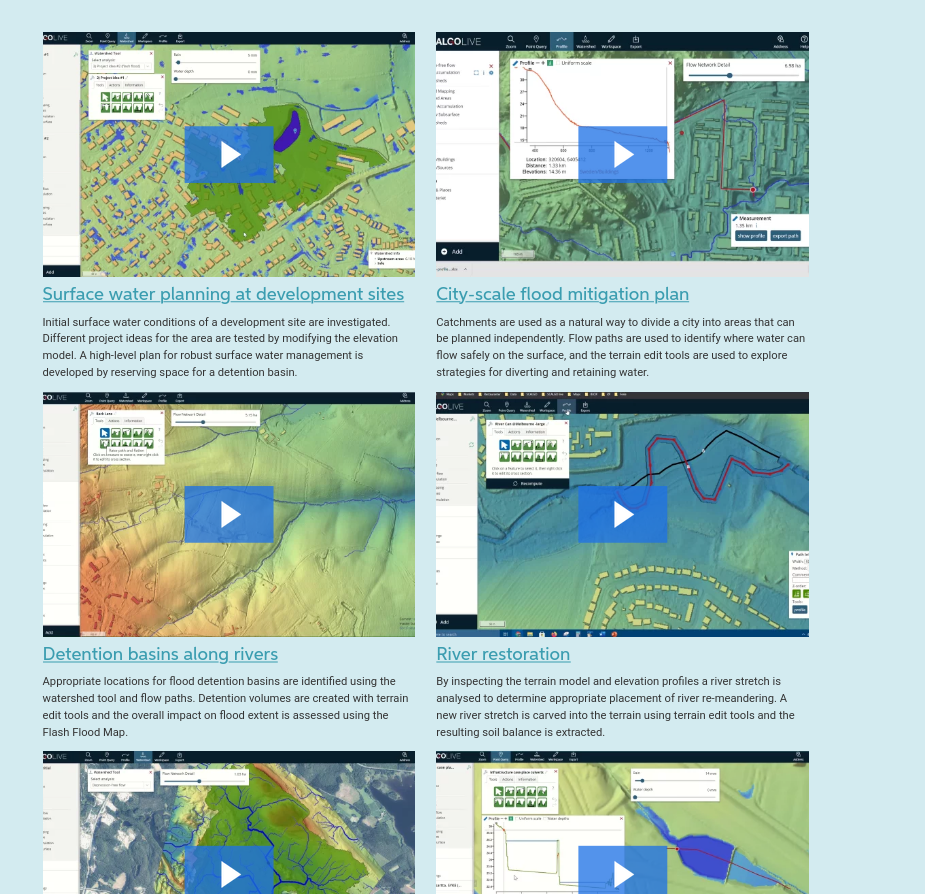
Just getting started with SCALGO Live? We also have a number of getting started videos that can help you with the basics.
Links to the use case and getting started videos are available from the Help menu inside SCALGO Live.
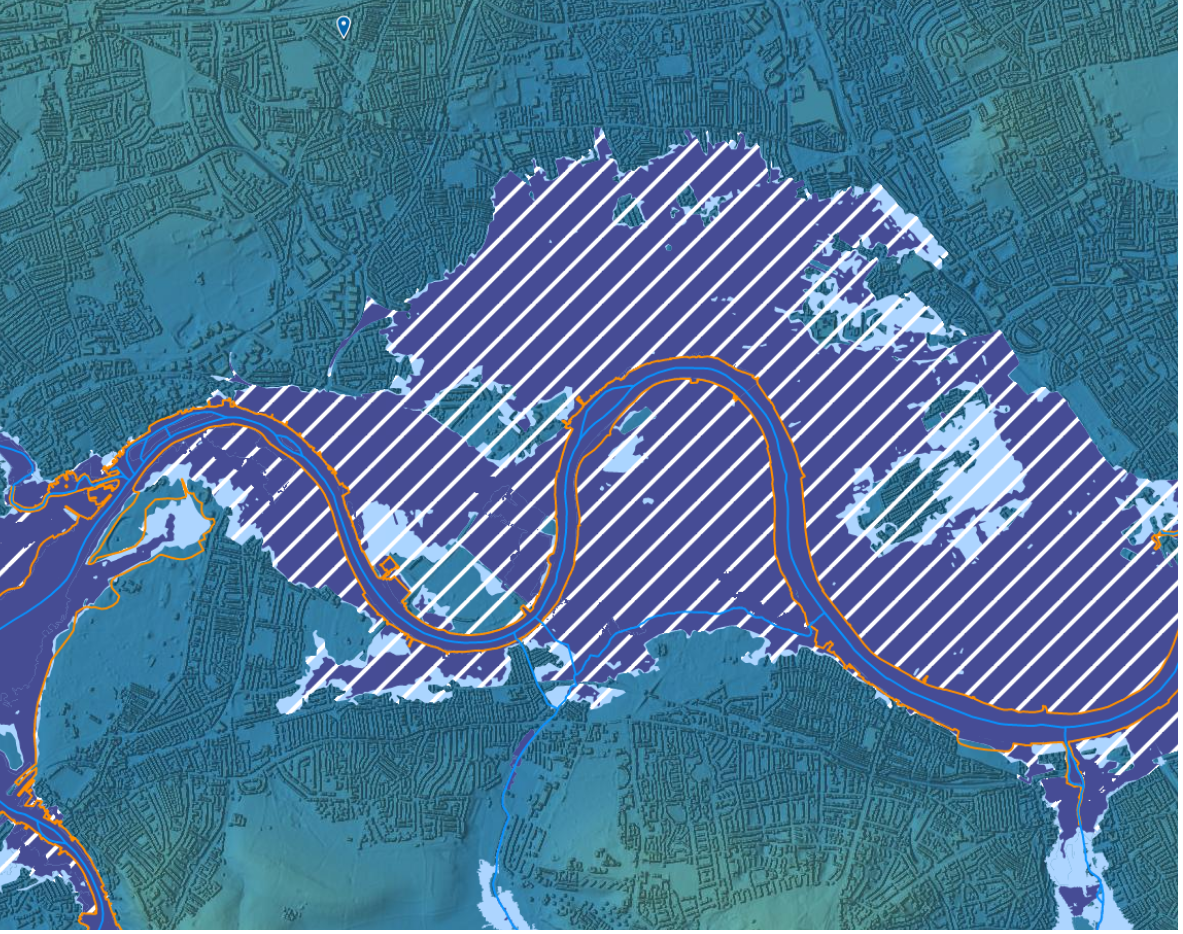
Access a EA flood maps inside SCALGO Live
By popular demand we have made some of the Environment Agency flood risk assessment maps and flood zone maps for England available directly in SCALGO Live.
Flood maps for planning
From the flood maps for planning service we have added the following layers:
- Areas benefiting from flood defence
- Flood defence
- Flood storage area
- Flood zone 2
- Flood zone 3
- Main rivers
Flood warning information service
From the flood warning information service we have added depth and speed layers for the low, medium and high risk rainfall scenarios corresponding to return periods of 30, 100 and 1000 years. To make this easily accessible inside SCALGO Live we have created a slider that allows you to quickly navigate between the return periods. We have also given you filters on water depth and velocity so you can focus on areas with a certain minimum water depth or velocity.
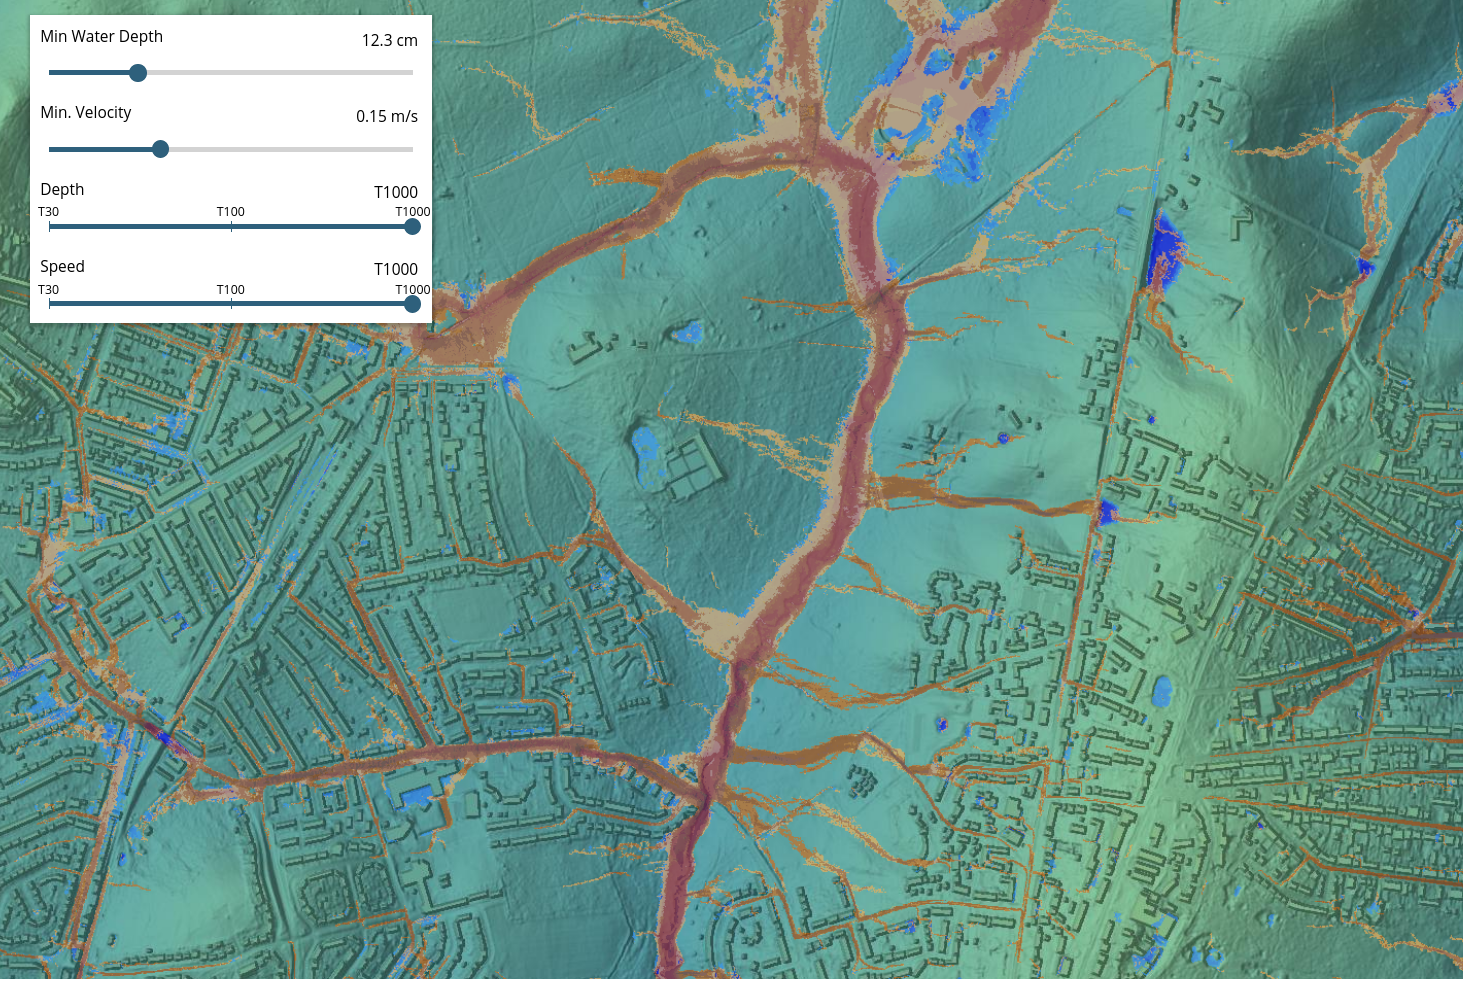
All the new layers are available from the library.
Improved map export
We have improved our system for exporting SCALGO Live maps to images as JPG and georeferenced PDFs. The new system is significantly faster than the old system and does a better job at determining an appropriate size for dialogs in the output, including the legend. By popular demand, we now also include vector data that you have dragged into SCALGO Live for visualisation in the exported document.
Try it out and don't hesitate to let us know what you think.
New powerful ways to edit the elevation model
A year back we asked ourselves: "What is the simplest and most intuitive way to shape the terrain and test how landscaping ideas influence the flow of surface water?". Since then we have worked hard, and today we release a brand new set of tools. Check it out in SCALGO Live, and let us know what you think.
Here we establish two basins and integrate them into the surrounding terrain.
Interested in learning more? You can sign up for our next webinar where we will demonstrate the tools in detail. The webinar is available in English and in Danish.
Read more about how to work with the new contour tools in the documentation.
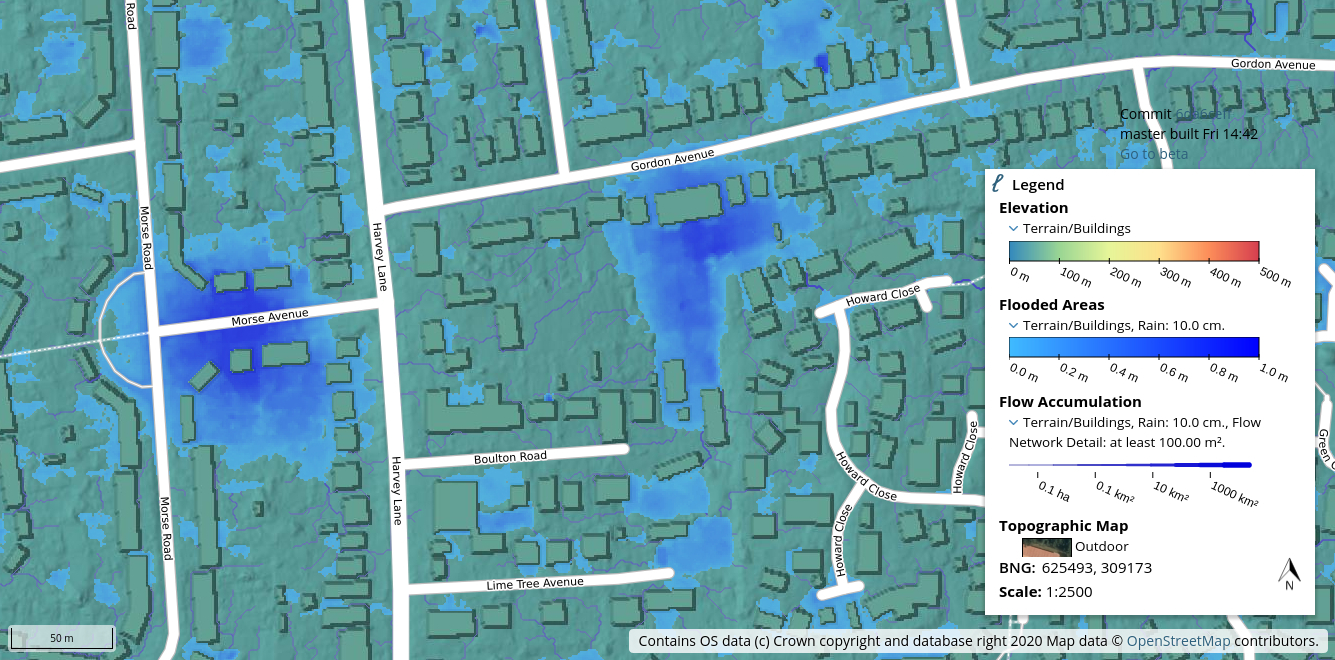
Better coloring of flooding layers and sea-level depth filtering
The default coloring of flooded areas is now based on water depth, such that shallow areas are light blue and deep areas are dark blue, instead of the event based coloring that has been the traditional default choice in SCALGO Live. This makes the maps more intuitive and problematic areas easier to distinguish. The event based coloring is still available in the layer settings . In parallel we are also rolling out support for depth filtering in the sea-level rise analysis. This happens on a country-by-country basis.
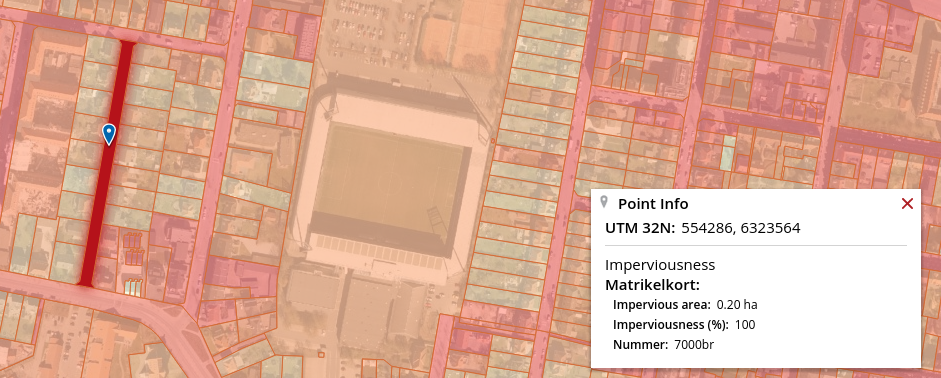
National Danish High-Resolution Impervious Surface Mapping
Today we announce the availability of a nationwide high-resolution mapping of impervious surfaces for SCALGO Live in Denmark. The map, produced by SCALGO, is based on machine learning techniques and has a resolution of 20cm. It is available as a standalone layer in the Imperviousness category in the library. In Danish the category is called Befæstelseskort.
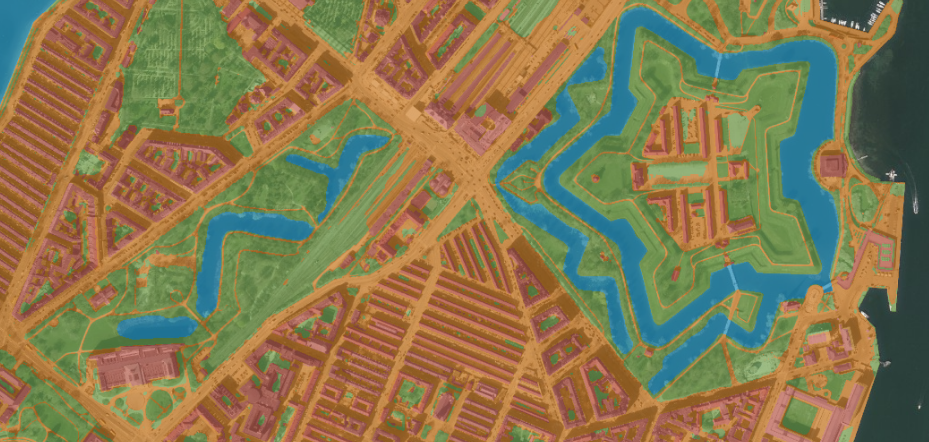
The mapping of impervious surfaces segments the country into 3 different classes: pervious, impervious and lake. The category is further subdivided into a building type and a general other impervious category.
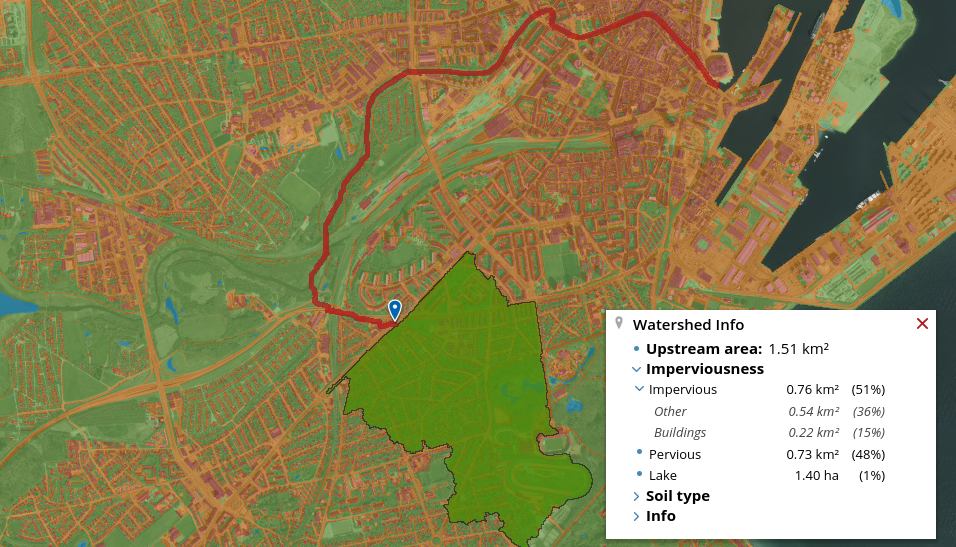
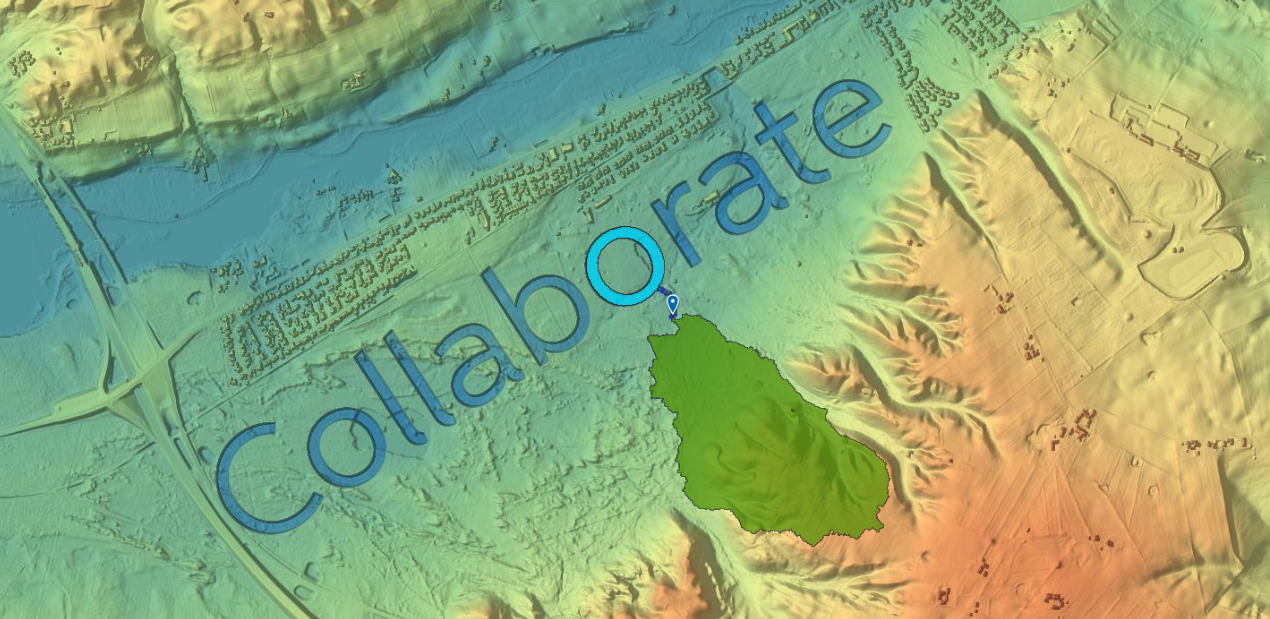
Watershed queries
When you perform a watershed query you get the total area of impervious surfaces in the watershed.
Annotated administrative regions
We have annotated a number of datasets, including the cadastral parcels, sewer catchments, planning zones as well as municipal regions with information about imperviousness. You can find those layers in the Imperviousness category alongside the impervious surfaces map itself. For each polygon in those data sets we have added a field that provides the total impervious area in the polygon, as well as the percentage of impervious surfaces.
National access for local and regional organizations
We now give local users (e.g. municipalities and water utilities) access to the full national SCALGO Live setup in their country.
As a consequence, workspaces and links can now be shared freely between consulting engineers and local users. See the manual for more info on how to share workspaces.
Note that if you previously had access to a local theme to facilitate sharing (e.g., you are an engineer working for a municipality), this access will be revoked as it is now unnecessary and the local themes will be retired.
Special notice for WMTS users
If you use SCALGO Live WMTS services in external GIS software you will have to update your service URLs. You can fetch a fresh WMTS link in the ticket configuration page. No other changes are necessary. If you do not have easy access to change your WMTS settings and need a little time in which the old system is still available, please contact SCALGO Live support.