About – What's New
Detailed information about watershed composition
We have updated SCALGO Live in Sweden, Norway and Denmark with a powerful new interation of the watershed tool. When you use the watershed tool you now get information about the composition of land use and/or soil types in that watershed.
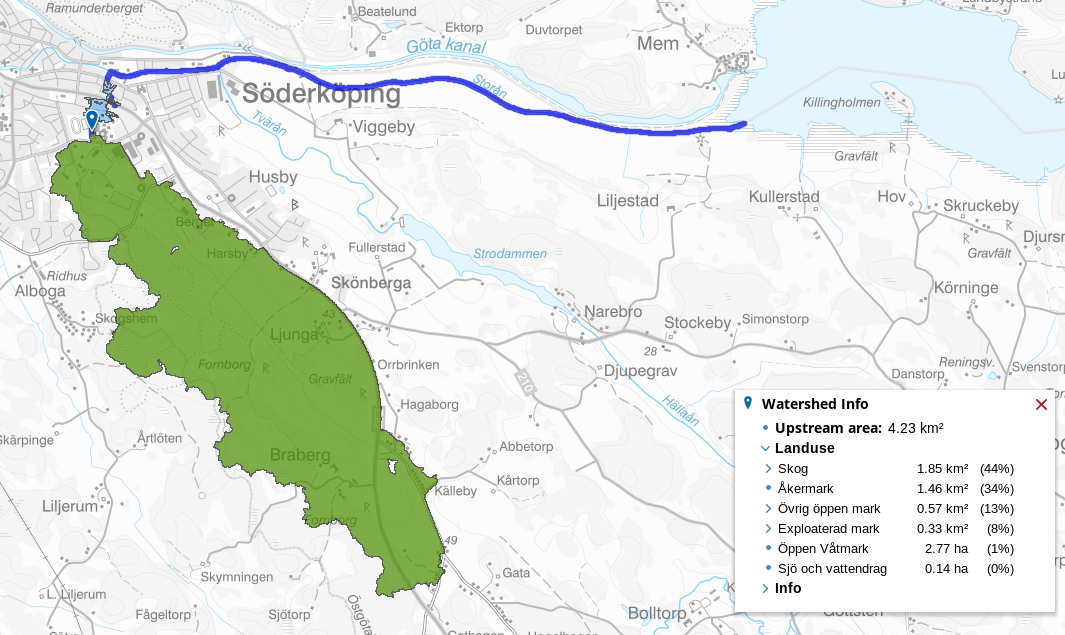
The following data is available in each country:
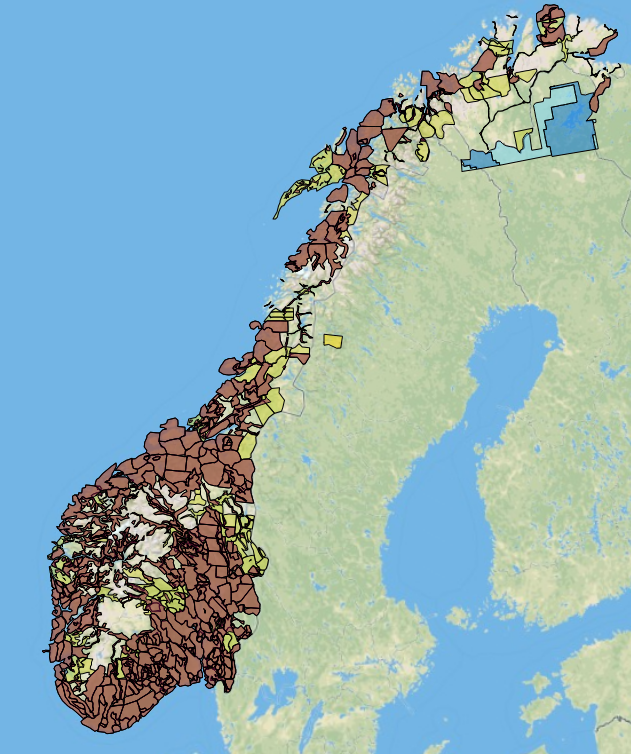
- Norway: Land use and soil type (more information).
- Sweden: Land use (more information).
- Denmark: Soil type (more information).
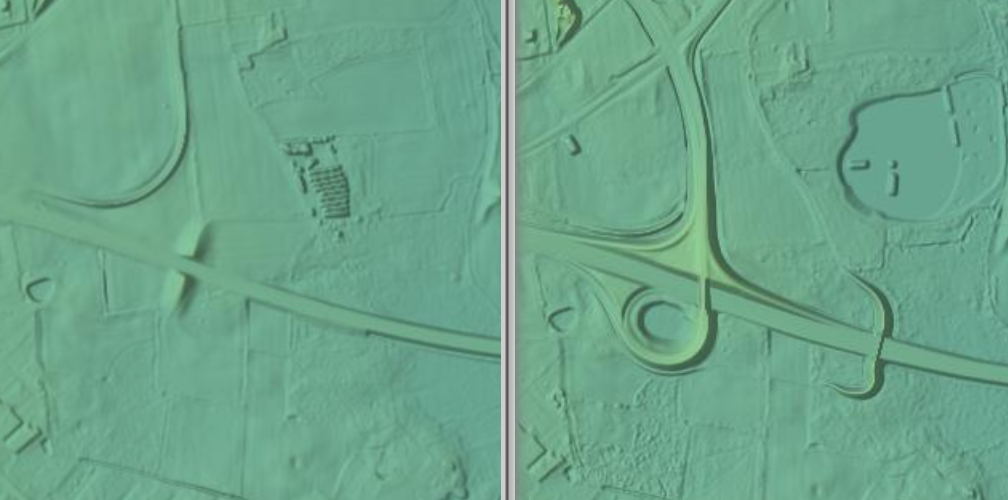
New Norway Elevation Model
We have updated the national elevation model based on the newest data from Kartverket, the anlyses have been updated accordingly. Also, we're using a more detailed building dataset (N5 instead of N20), so also smaller sheds etc. are included.
Updated GeoDanmark data
We have updated the GeoDanmark data in SCALGO Live Denmark. We are now serving data in the newest GeoDanmark specification (version 6).
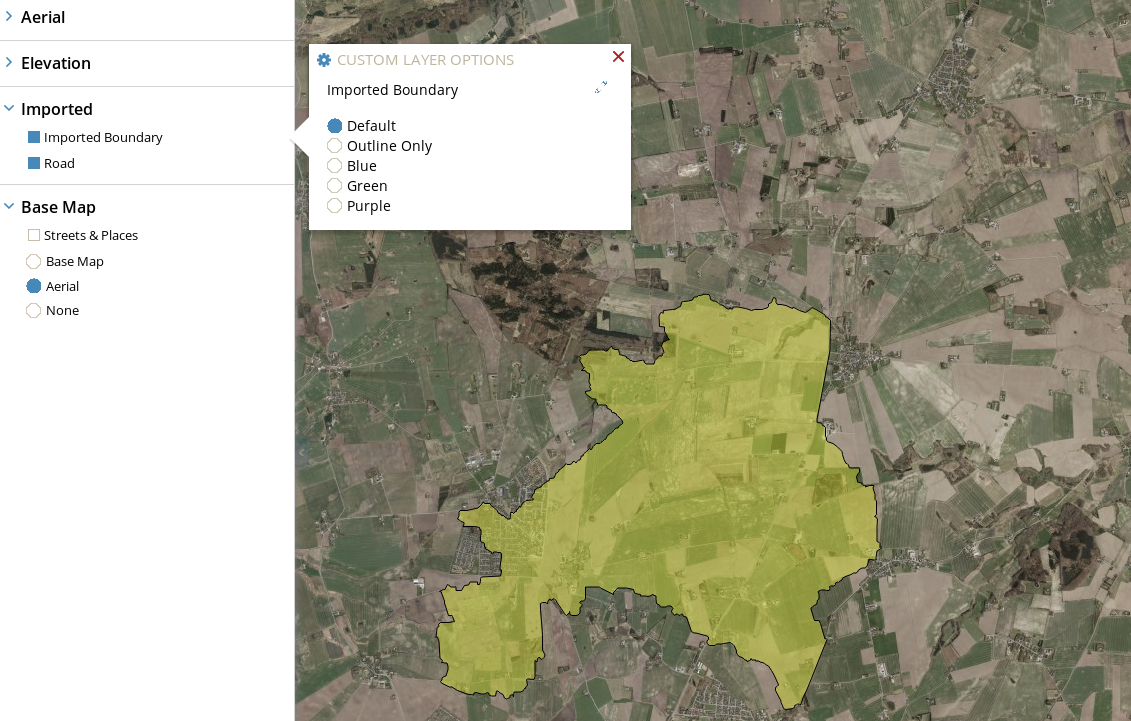
Better styling of imported vector layers
You can now change the color of vector datasets you have imported into SCALGO Live by dragging them onto the dock. You can access the new styles in the gear menu for the imported layer.
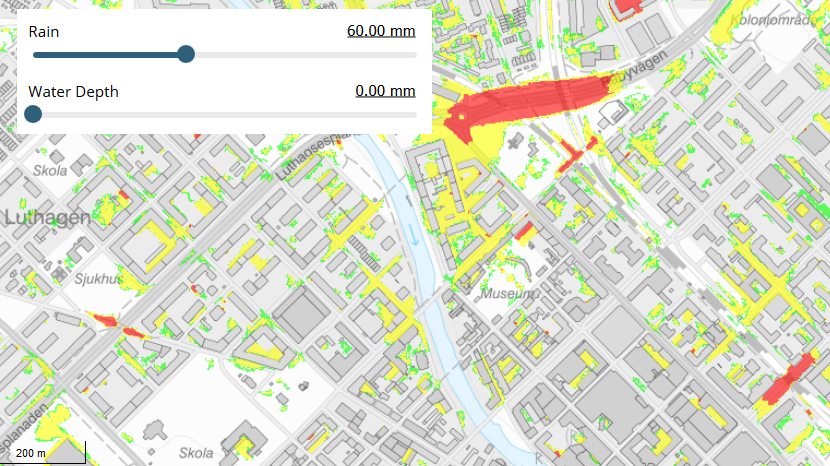
New Swedish Base Map
We have switched the view projection for SCALGO Live Sweden to the national Swedish coordinate system (SWEREF 99 TM). This implies that we can now use the standard base map put out by Lantmäteriet: topografisk webbkarta. The base map comes in two styles, one with muted colors (shown below) and one with full colors. This should also make it easier to integrate SCALGO Live with certain online GIS and will improve the precision of elevation profiles.
Note: As part of this change we have made two minor changes to the Swedish flash flood map. In the flash flood map watershed layer we now visually distinguish watersheds that end up in the sea in different places. This new rendering implies that if you put the rain slider so high that all depresssions are full, the flash flood map watersheds visually match those from depression-free flow. The actual definition of the watersheds have not changed as a result of this update, it is purely a change in visualization. Furthermore, we now fill all depressions in the DEM of a volume smaller than 3 m3 (used to be 1 m3), resulting in a cleaner flash flood map with fewer spurious sinks.
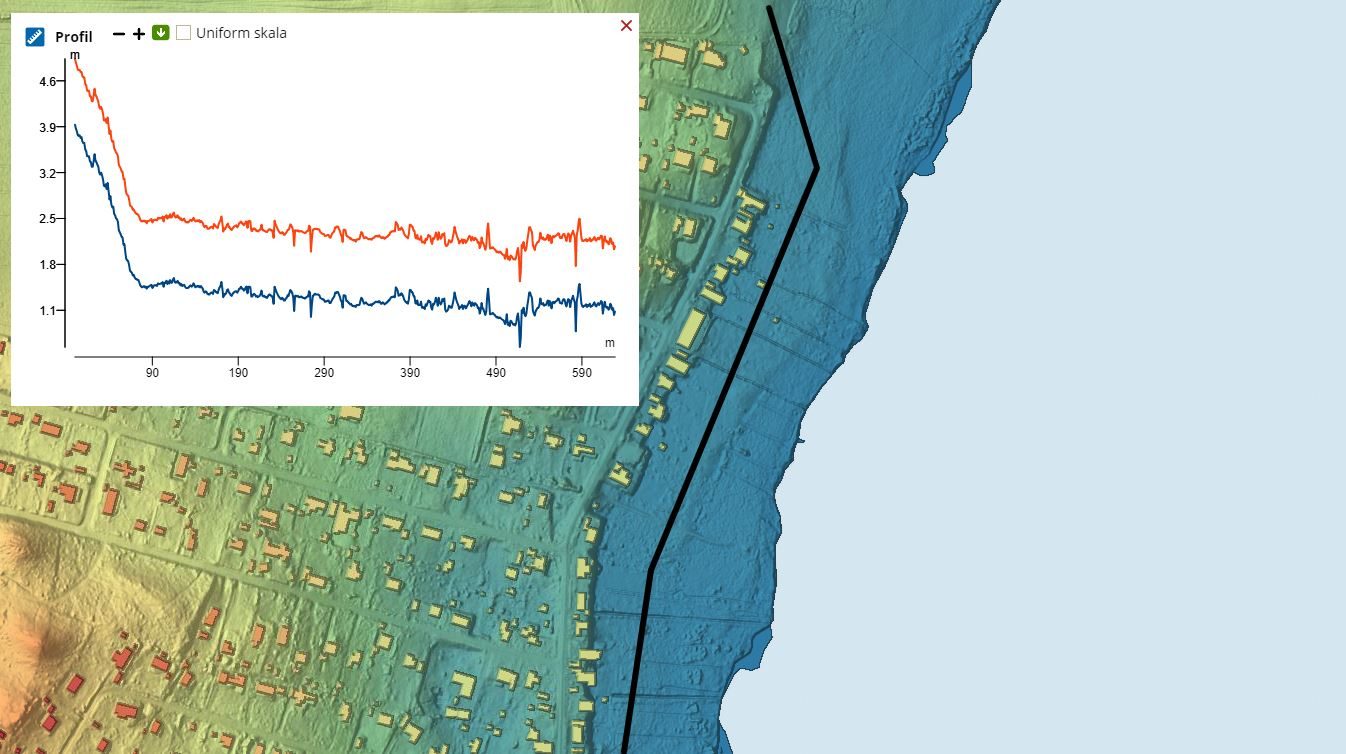
New Danish Elevation Model
A few days ago SDFE released an updated version of the Danish elevation model. The updates come from a newly acquired point cloud covering Fyn and Djursland primarily, but the model has also changed elsewhere. The complete model is now available for use in SCALGO Live under the name Denmark/2018 - you can find it in the library. The Denmark/2015 model is still available and our analyses have not (yet) been updated. You can create workspaces from the Denmark/2018 model using the "Existing Model" button in the workspace creation menu. You will automatically get the hydrological corrections in your workspace.
Work with gradients in the profile widget
You can now work with gradients of your workspace terrain edits. You can set a constant gradient across the length of the feature and you can get information about the gradient of edges adjacent to each vertex. You can now also right-click to fix individual vertices. This allows you to efficiently change the slope of sub-paths.
Denmark: updated national computation
We have refreshed the Danish national analysis using GeoDanmark data (e.g. building footprints and hydrological corrections) from February 2019.
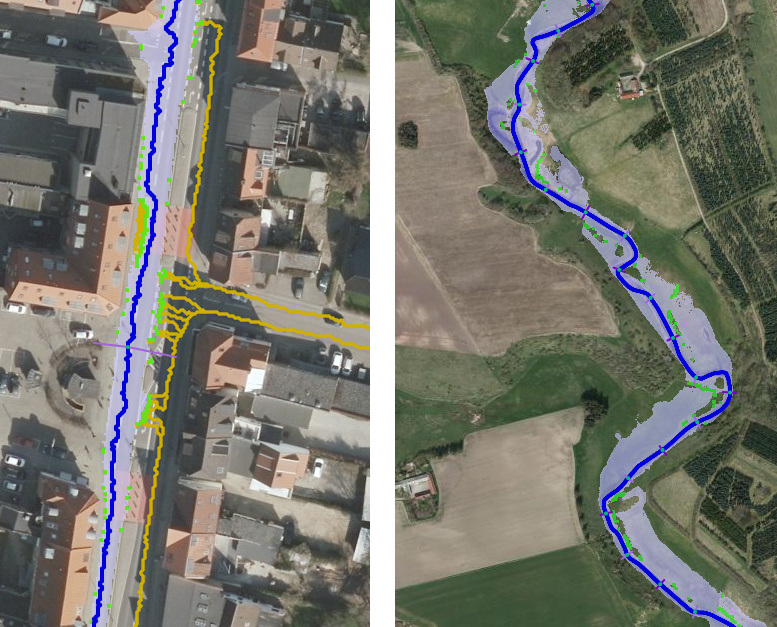
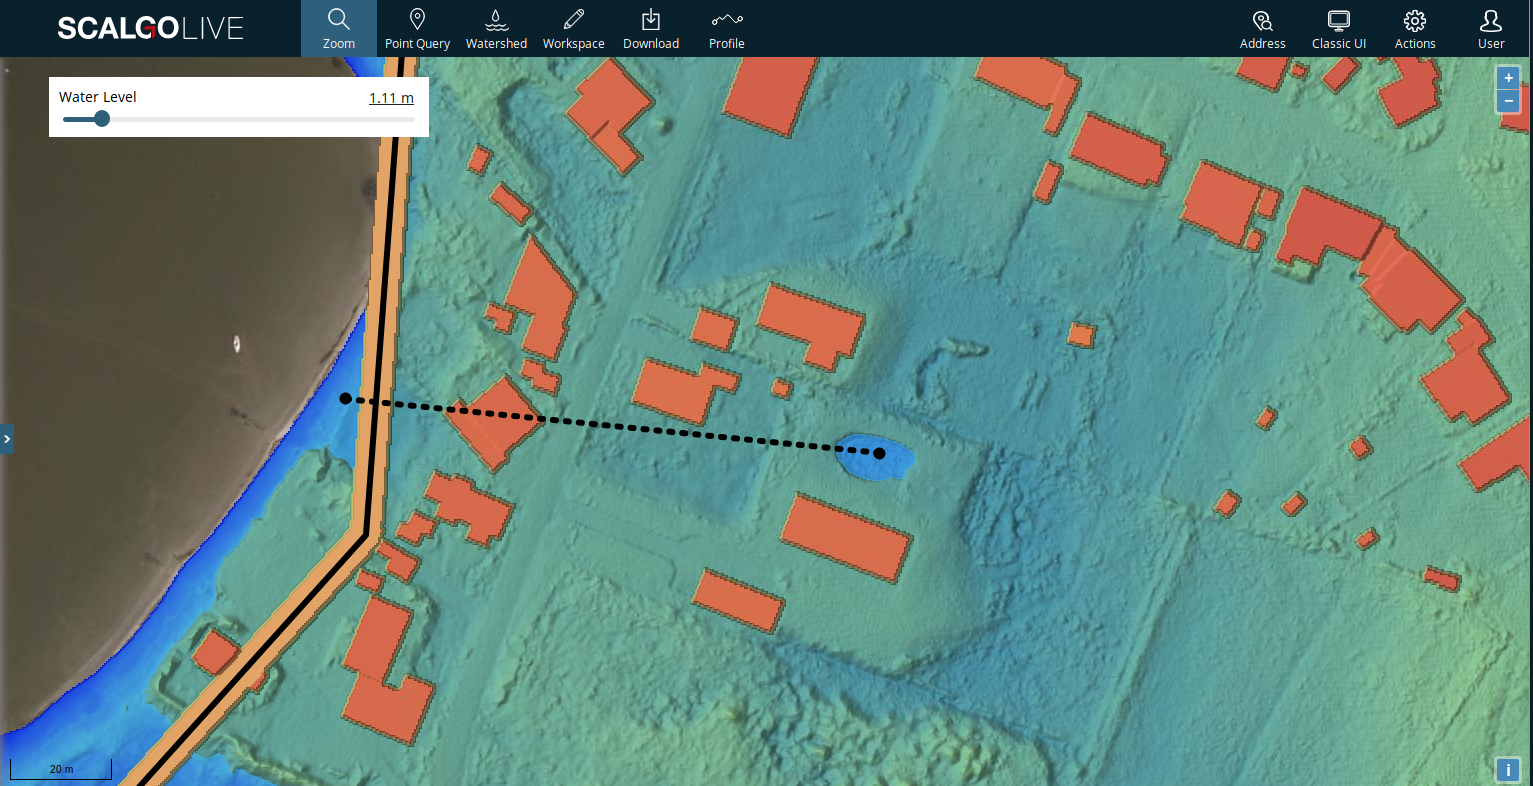
Flood risk screening from rivers and flow paths
We are proud to announce the Danish release of our new SCALGO Live add-on module to estimate flood risk from water flowing in streams, rivers, ditches and along roads. In fact, you can use the new module to estimate the flood risk of any flow rate and along any flow path in the high-resolution Danish elevation model (260 billion elevation cells). The feature is fully integrated into SCALGO Live with both a national analysis and powerful workspace options for working with water flows both in streams and on roads. If you are a Danish user then contact us for more on obtaining access to the new module. If you are a user outside Denmark then stay tuned, we are working hard to release this in more countries.
You can read more about the new functionality in the manual and in the full release announcement.
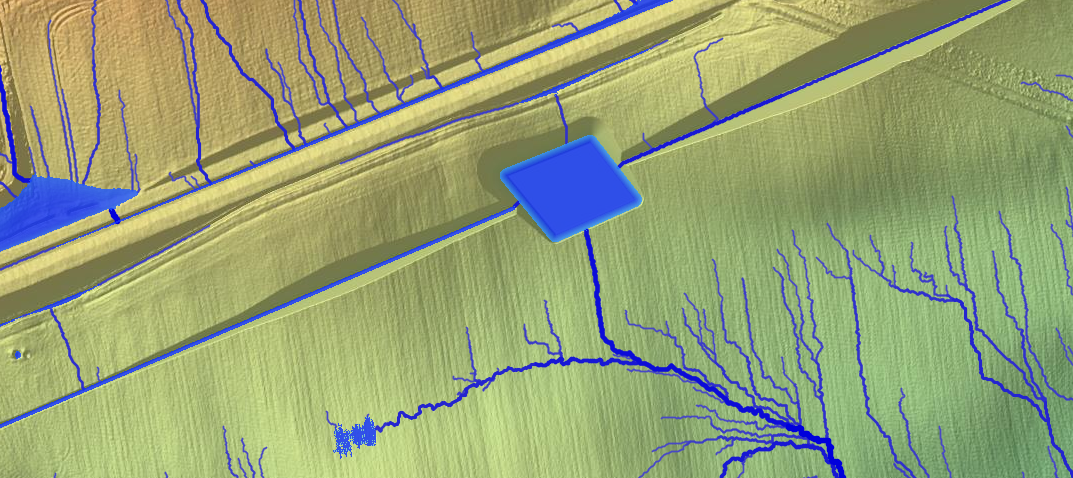
New workspace tool: Raise and lower terrain uniformly
We have added a new terrain edit tool for workspaces. The tool allows you to draw a path or a polygon and raise or lower all parts of the terrain covered by the object by a fixed amount. This is useful for e.g. modeling water tubes in emergency response situations where the water tube follows the terrain instead of being set at a fixed absolute elevation.
Importing LandXML TINs, LAS point clouds
We have extended import support with several popular file types. These include TINs (triangulated meshes) stored in LandXML or Shapefiles, exportable from BIM/CAD software (such as Trimble Novapoint, AutoCAD Civil 3D and Bentley InRoads/PowerCivil), as well as point clouds stored as LAS files. These formats are supported for constructing workspaces, but more importantly for including new data into existing workspaces. This allows, for example, constructing a workspace on a national model for context, and then importing a newly planned road or re-designed terrain on top.
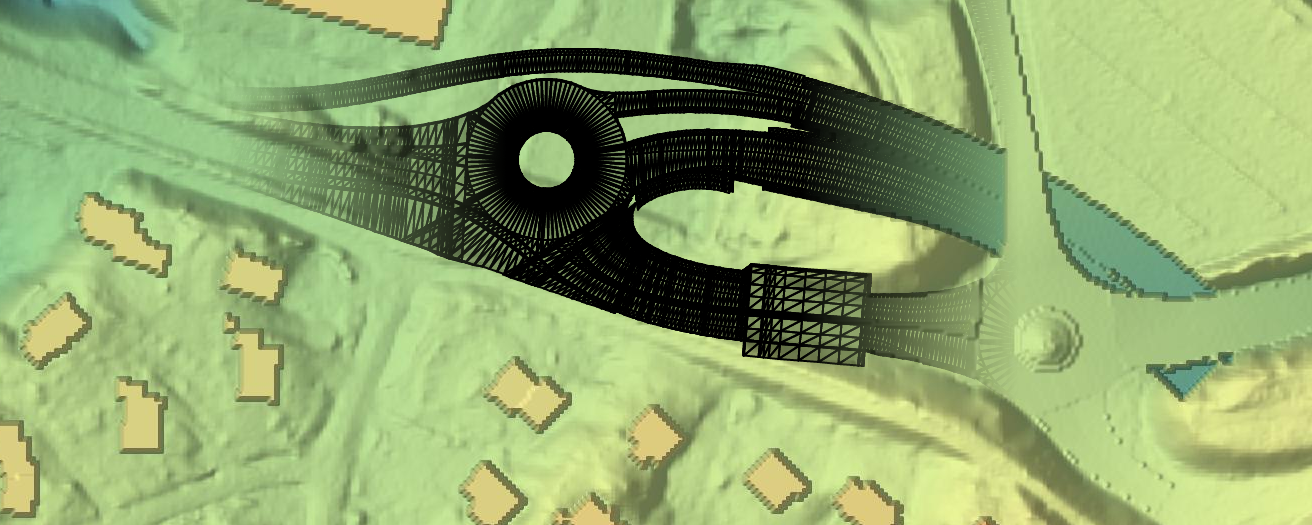
You can read more about the extended import support in the manual.
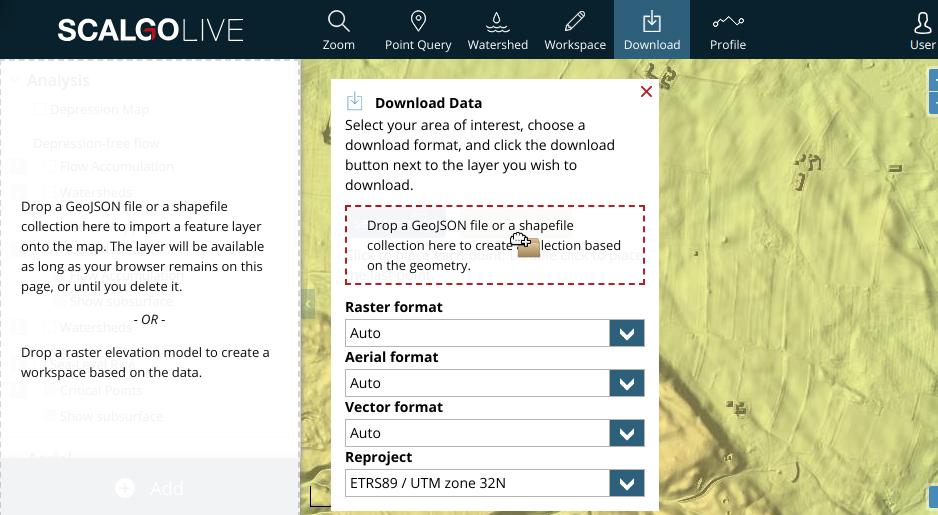
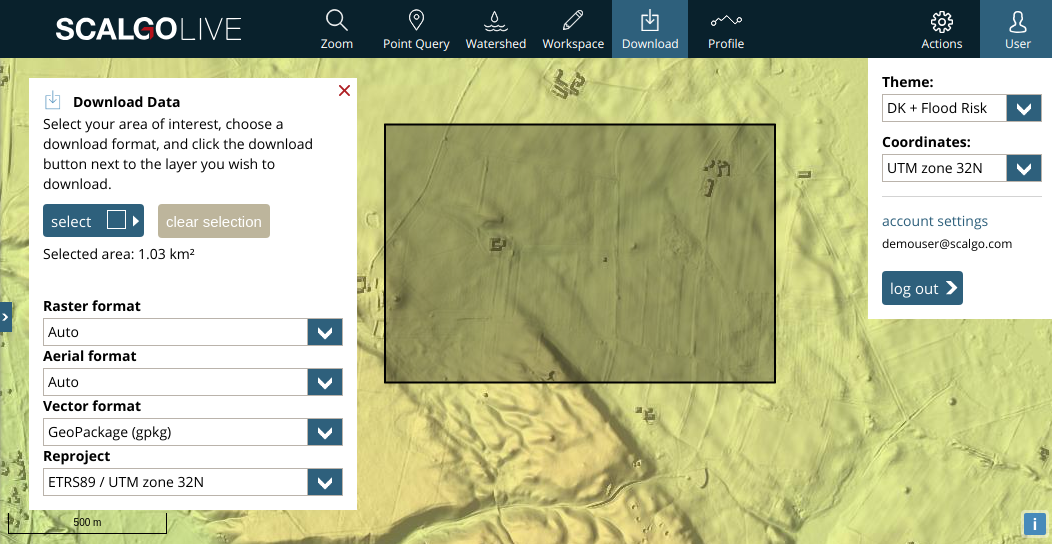
Download format selection for polygon downloads
It is now possible to set default formats to be used when downloading data from SCALGO Live in the bottom of your account page. The selected vector format will be used when downloading upstream polygons using the watershed tool, and exporting depression polygons from the Depression Map. Previously these would always be exported as Shapefiles.
The selected defaults for vector, raster and aerial data will also apply for normal downloads, but you can still change away from the default in the download dialog as before.
Denmark: updated national computation
We have refreshed the national analysis using GeoDanmark data from November 2018. We now get the hydrological corrections directly from GeoDanmark. This implies that the changes to the hydrological corrections made before November 2018 are reflected in this computation.
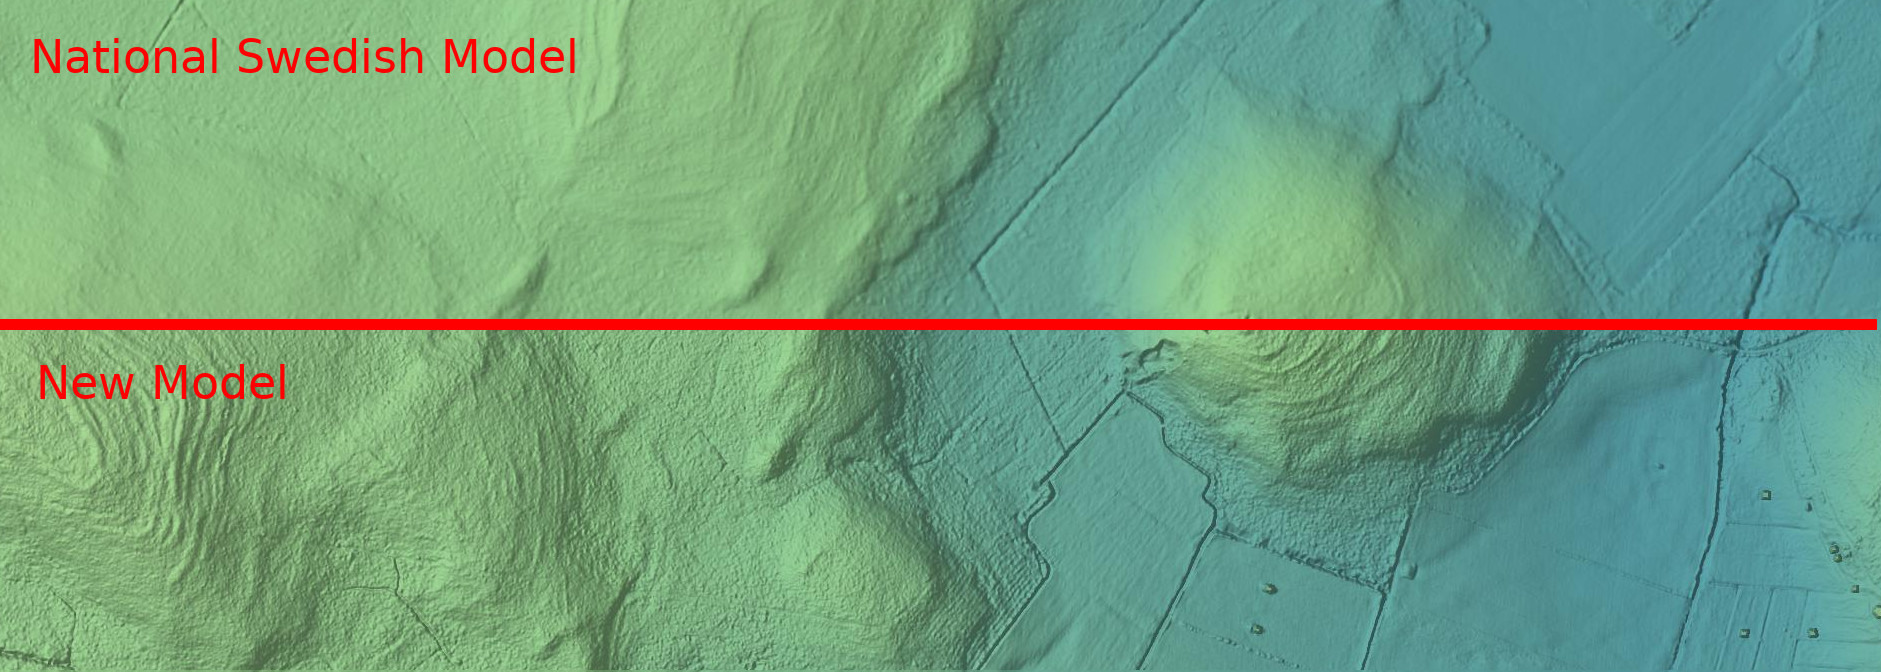
New model in Sweden
Recently, the Swedish mapping authority, Lantmäteriet, released the Laserdata Skog point cloud as open data. We have made this dataset available for our SCALGO Live Sweden users. You can find it in the library through the "Add" button in the bottom left of your screen.
The current dataset covers only a small part of the country. It will be updated regularly by Lantmäteriet and we will also keep it updated in SCALGO Live. It has about 1-2 points per square meter, and is made available as a 1 m raster in SCALGO Live. In comparison, the national Swedish model is a 2 m raster.
Naturally, the data is also available for download and for use in workspaces. If you want to use it in a workspace, use the "Existing Model" option in the workspace creation dialog. After selecting your region you can then click the green pencil next to the elevation model to create your workspace.
You can read more about Laserdata Skog in the manual.
Side slopes on workspace features
By popular demand it is now possible to create paths and areas with non-vertical side slopes (banks) in your workspace. Use this new feature to make your terrain edits look more realistic and get closer to the final design of your solution. Interesting use-cases for this new feature include:
- Estimate the surface area required by a new channel or retention basin including the extra width taken up by the banks.
- Achieve more accurate volume estimates for basins.
- Bring more realistic and better-looking project proposals and screenings to stake holders and the public.
- Improve performance in subsequent processing, e.g. in hydro-dynamic modeling.
See the manual for details on how to add side slopes to your features.
Bigger workspaces
We have increased the workspace size limit significantly, by factor of 5 in most cases.
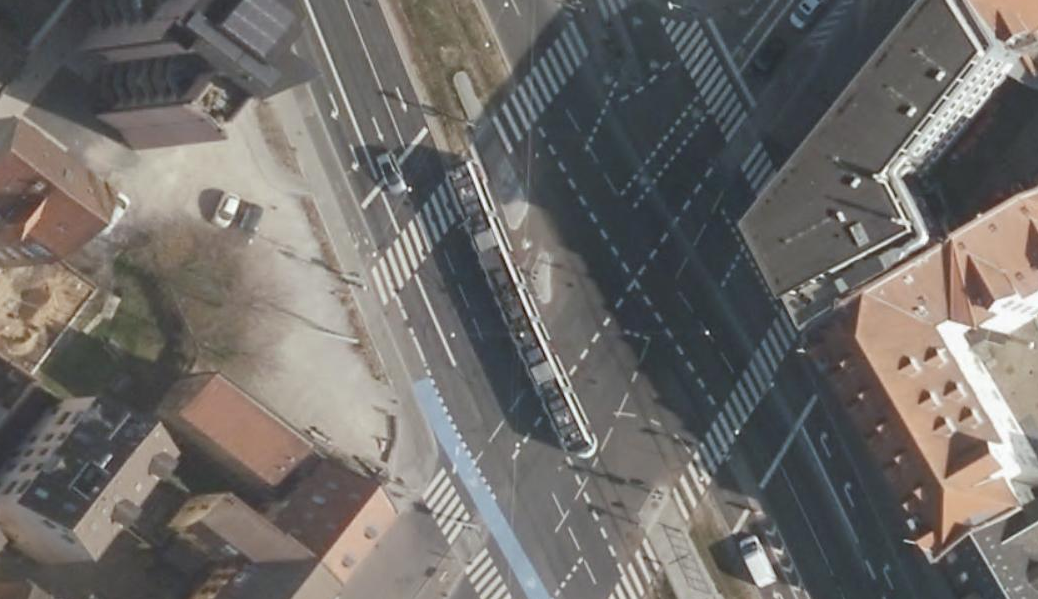
Updated Orthophotos in Denmark
The new Danish orthophotos from spring 2018 are now available for viewing and download in SCALGO Live. Find them in the library.
Drag and drop enhancements
You can now specify a boundary polygon for workspace creation and downloads by dragging a Shapefile or GeoJSON file onto the creation/download dialog. Drag and drop styling has also been improved throughout the UI.
Download and vectors
We have released a number of updates related to downloading data from SCALGO Live:
- We now support DXF and GeoPackage for downloading vector data.
- Furthermore you can now control the coordinate system of the downloaded data. You can choose the coordinate system from the download dialog. If you pick a new coordinate system (from the top right menu) this setting will also be reflected in the download dialog.
- There is a new download option in the Flash Flood Map: building information. If you choose this option you will download building footprints annotated with information about water in depressions neighboring the buildling. See the manual for more information.
Subsurface in sea-level rise computations
Subsurface edits in workspaces are now included in the sea-level rise computations. They were previously ignored.
Denmark: National Computation
The national sea-level rise computation has been updated to use the national set of hydrological corrections as subsurface structures. This implies the analysis is no longer based on the Denmark/2105/Sea model, however the model will remain available in SCALGO Live for use in other tools. All computations have been updated to use newer GeoDanmark buildings (accquired from Kortforsyningen 6th of April 2018).